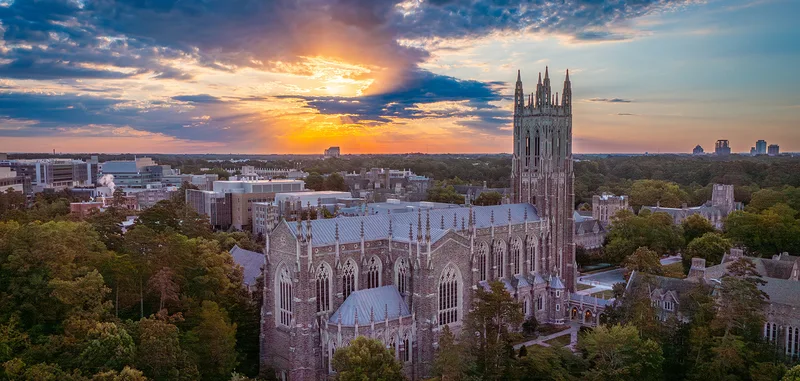

Strong research opportunities, ACC competition and a spirited residential campus attract athletes with ambitious academic goals.

NCAA Division IAtlantic Coast ConferenceCalifornia

Stanford University Football
One plan built for Stanford University Football, with the roster read, the coach's contact and a dated plan, delivered within 24 hours. An expert checks every plan.
- 112
- Roster
- 34
- Leaving
- 27%
- In-state
- 5%
- Transfers
Overview
Stanford University Football Team Details
Key facts about the Stanford University football team.
In Stanford, California, Stanford University competes in Division I FBS football through the Atlantic Coast Conference. After the 2026-27 season, it loses seven offensive linemen, the most of any position group, followed by five defensive linemen. By winning percentage over the last five seasons, at 27%, it sits in the bottom 10% among FBS programs.
NCAA Division IAtlantic Coast ConferenceCalifornia
- Head coach
- Tavita Pritchard
- Home venue
- Stanford Stadium
- Average roster
- 110
- Five-year win rate
- 27%
Bradford M. Freeman Director of Football
players a season
Fit check
Do You Fit at Stanford University?
Pick your position and level, add a test score if you have one, and get an instant read on your chances here. Free, and no account needed.
Coaching staff
Get on This Staff's Radar
Head coach
Tavita PritchardBradford M. Freeman Director of FootballEmail●●●●●●@●●●●.edu
Phone(●●●) ●●●-●●●●
Roster
Roster Breakdown
The roster by class
26FreshmenFr.
17SophomoresSo.
31JuniorsJr.
20SeniorsSr.
14GraduateGrad
108 players on the latest roster (2026).
Roster openings after 2026-27
34players in their final year, 30% of the roster
Quarterback 2 · Running Back 2 · Wide Receiver 5 · Tight End 1 · Offensive Line 7 · Defensive Line 5 · Linebacker 5 · Defensive Back 4 · Specialist 3
After the 2026-27 season, seven offensive linemen will leave, the largest group of departures by position, followed by five defensive linemen.
See who you would be replacingBuilding through freshmen is the norm here, as transfers make up 13% of the roster versus a median of 31% among FBS programs.
Positions
Football Roster by Position
How many players a season the program carries at each position, and how tall they are.
Quarterback
5.3players a season
Average height 6'2"
Running Back
6.3players a season
Average height 5'10"
Wide Receiver
14.3players a season
Average height 6'1"
Tight End
7players a season
Average height 6'5"
Offensive Line
16.3players a season
Average height 6'5"
Defensive Line
15.3players a season
Average height 6'4"
Linebacker
5players a season
Average height 6'2"
Defensive Back
19.3players a season
Average height 6'1"
Specialist
6.3players a season
Average height 6'2"
Transfers
Transfers In and Out
6
transfers in for 2026-27
0
transfers out
- Share of the roster
- 5%
- Per 100 freshmen
- 23
- By position
- Quarterback 2 · Wide Receiver 2 · Offensive Line 1 · Defensive Back 1
- Came from
- 5 from Division I, 1 from Division III
Footprint
Where This Team Recruits
Where the players are from
328players
In-state26.5%
Other US states71.3%
International2.1%
Counted from players on recent rosters with a known hometown.
Top home states
California27%
Texas13%
Georgia6%
Florida5%
New Jersey5%
No single state dominates, with the five biggest supplying just 56% of players, versus a median of 70% among FBS programs.
Results
Stanford University Football Recent Results
Swipe to see every season
2021
25%3-9overall
2-7conference
2022
25%3-9overall
1-8conference
2023
25%3-9overall
2-7conference
2024
25%3-9overall
2-6conference
Best season
2025
33%4-8overall
3-5conference
Placing in the bottom 10% among FBS programs, the team has a 27% winning percentage over five seasons, behind a 54% median. Results improved a little in 2025, to a 33% winning percentage and a 4-8 record, still the best of the last five seasons.
Recruiting
Recruiting Outlook
Stanford football competes at the NCAA Division I FBS level in the ACC, so athletes face a high-performance environment and a demanding national schedule. The program has an established history of conference and postseason success, while its recent seasons suggest a rebuilding context. Stanford's academic standards also make the overall recruiting process more selective than athletic evaluation alone.
ACC Power Four competitionDivision I FBS roster depthHighly selective academic environment
Recruiting difficulty
80/ 100Very Hard
OpenCompetitiveSelectiveElite
The program is not currently a consistent national contender, but FBS competition, roster depth, and Stanford's academic admissions standards make roster opportunities highly competitive.
What coaches value
- Position-specific size, speed, strength, and athletic upside
- Football intelligence, processing speed, and assignment discipline
- Consistent competitive effort, toughness, and coachability
- Academic preparation and character that fit Stanford's demanding environment
How to get recruited here
Build verified film that clearly shows your position-specific strengths against strong competition, then contact the recruiting staff with measurable testing results, academic information, schedule, and transcript context. Attend evaluation opportunities and camps when possible, and keep communication focused on development, fit, and realistic position projection.
How hard is it to make the team
Making Stanford's football team is difficult because it competes in Division I FBS and the ACC, where recruited athletes typically have strong size, athletic testing, and game experience. The academic admissions process adds another layer, so prospects generally need both credible Power Four-level football ability and a strong academic profile.
Who fits this program
- Football players seeking highly competitive Division I FBS competition
- Athletes prepared to balance selective academics with demanding schedules
- A medium-sized suburban campus with residential student life
- Self-directed athletes comfortable developing within deep roster competition
Videos
Stanford University Football Videos
Program stats
The Program by the Numbers
110
Athletes on the roster
11
Coaches on staff
$73,424
Spent per athlete
Spending and revenue a year
Spending$35,992,019
Revenue$35,992,019
Revenue covers everything the program spends.
The operating budget is above its peers: around $89,000 per athlete in the 2025 EADA report, more than twice the FBS median.
Source: the federal Equity in Athletics report, 2025.
Feeders
Top Feeder Schools and Clubs
The high schools and clubs that sent the most players to this roster.
1Christopher Columbus High School8 players on recent rosters2Oaks Christian School6 players on recent rosters3Gonzaga College High School4 players on recent rosters4Pinnacle High School4 players on recent rosters5Punahou School4 players on recent rosters
Recent rosters include eight players from Christopher Columbus High School, the most of any single school or club, ahead of Oaks Christian School with six. Repeat pipelines are common here, with Oaks Christian School, Gonzaga College High School, and Pinnacle High School also each showing up with at least two players.
The school
School Environment
Stanford University's research-intensive academic environment combines strengths in engineering, computer science and the humanities with demanding coursework, making academic preparation and long-term career fit central considerations for prospective student-athletes.
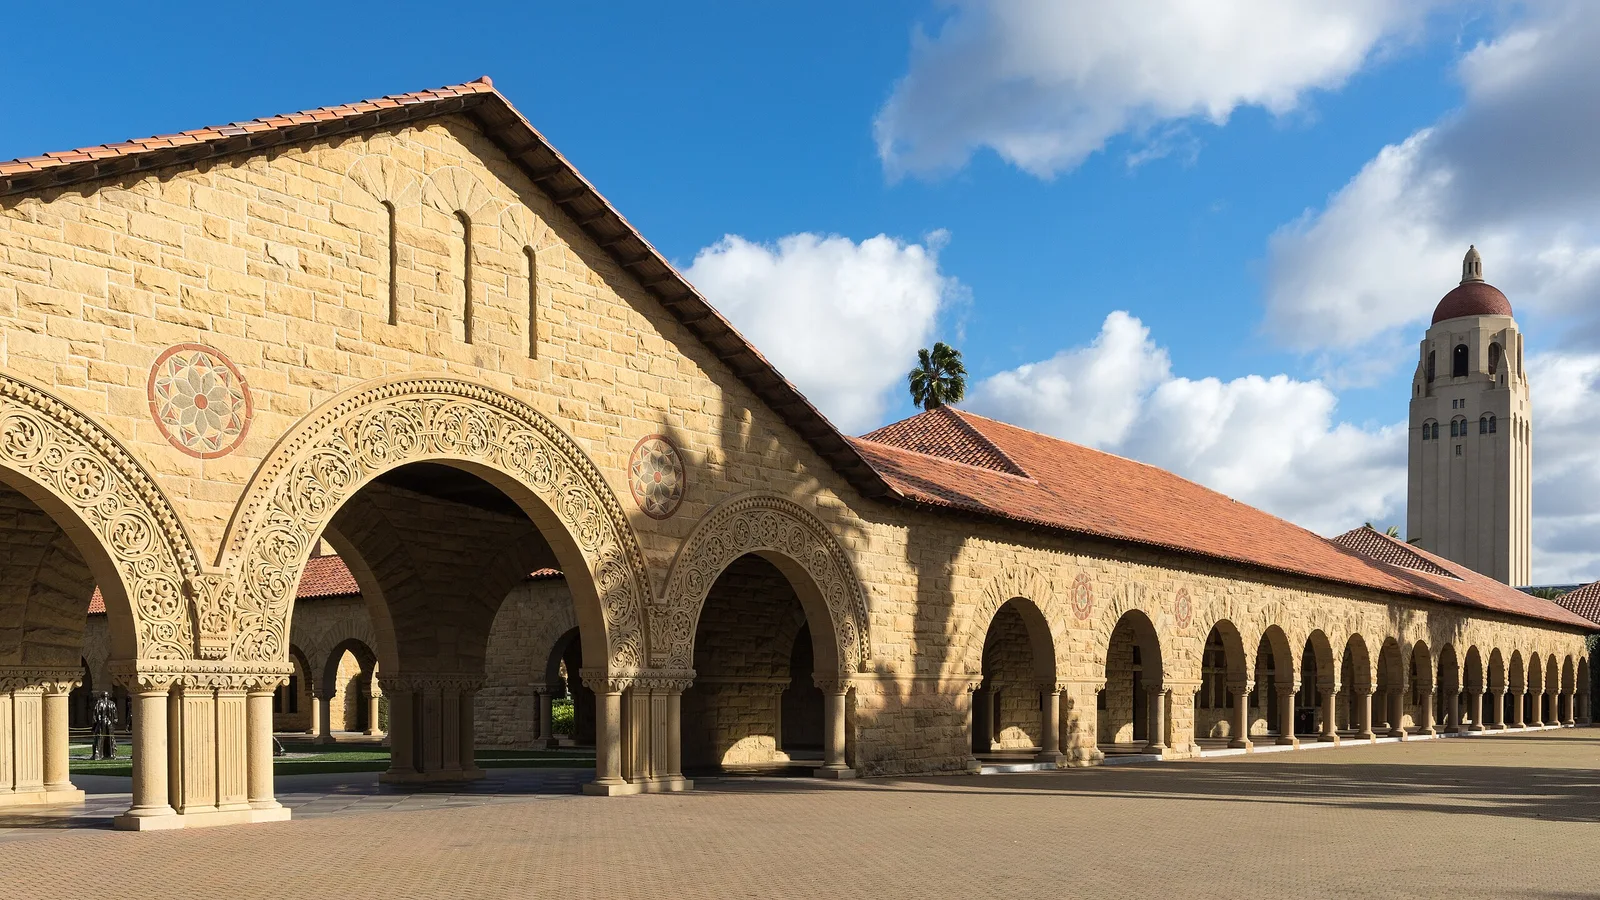 Stanford UniversityStanford, CaliforniaSee the full profile
4%
Acceptance rate
92%
Graduation rate
- Undergraduates
- 7,904
- Net price a year
- $13,807
- Earnings after ten years
- $124,080
Official links
Official Stanford University Football Links
Similar programs
Similar Football Teams
Programs at a similar level, with similar academics, worth adding to your recruiting list.


Competitive athletics, demanding academics and Boston access appeal to recruits who want substantial opportunities beyond their sport.
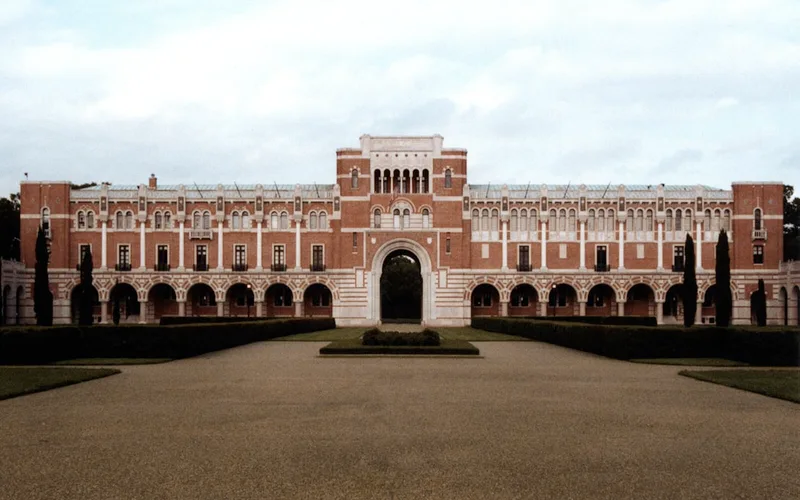

Challenging academics, close faculty connections and a residential college community complement the demands of Division I competition.


Academic flexibility, close faculty access and Ivy League competition draw athletes who want substantial challenges beyond their sport.
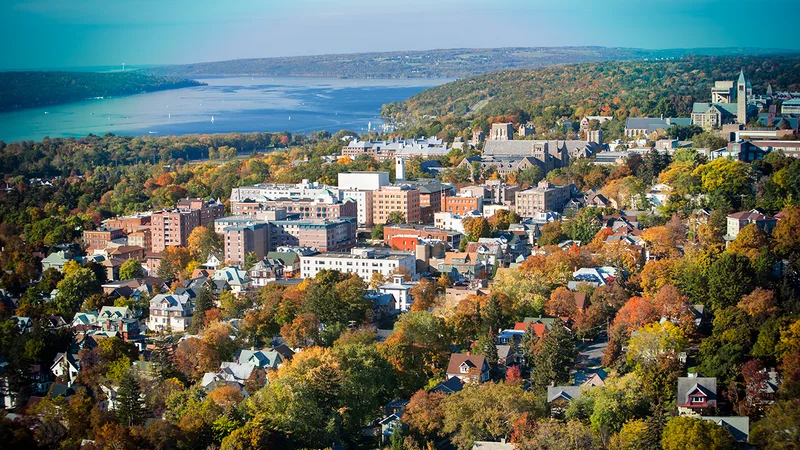

Ivy League competition, research opportunities and a residential campus appeal to athletes seeking an academically demanding experience.


Competitive athletics, rigorous academics and a close residential community appeal to recruits seeking commitment beyond their sport.
Teams in California
More Football Teams in California


California Polytechnic State University
San Luis Obispo, CA
Applied learning, competitive athletics and strong career outcomes appeal to recruits who take academics seriously.
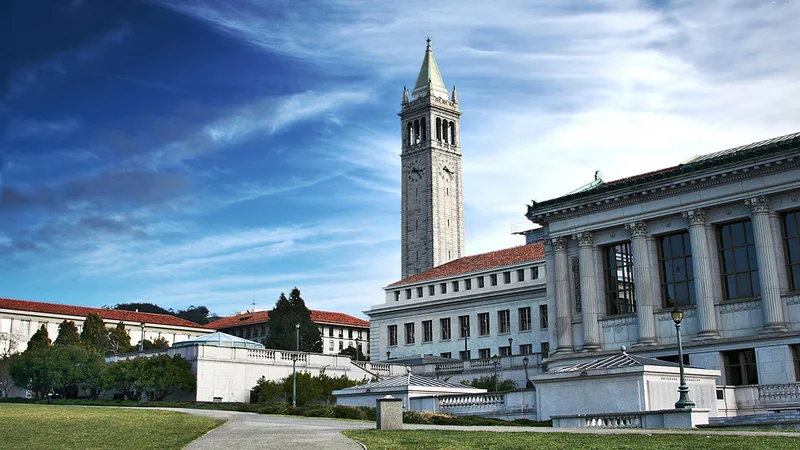

University of California, Berkeley
Berkeley, CA
Demanding academics, competitive athletics and Bay Area career opportunities appeal to athletes with ambitious goals beyond their sport.

California State University, Sacramento
Sacramento, CA
Competitive athletics, practical majors and capital-city internships give recruits several ways to build their future.


University of San Diego
San Diego, CA
Competitive athletics, strong career outcomes and a close-knit campus community give recruits several reasons to consider studying here.
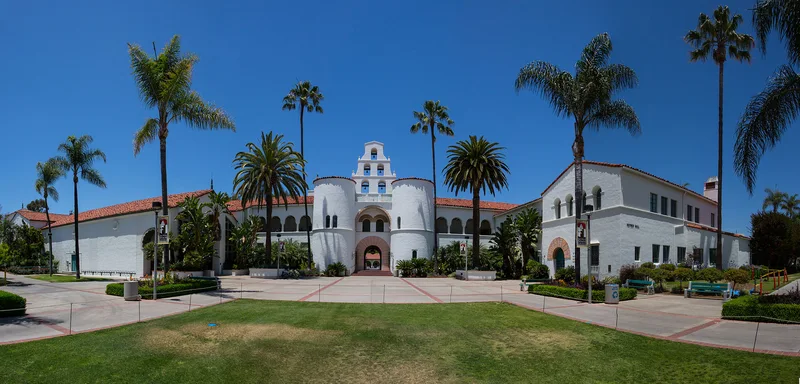

San Diego State University
San Diego, CA
Competitive athletics, regional career connections and an active urban campus give recruits several reasons to consider studying here.


San José State University
San Jose, CA
Career-oriented academics and Mountain West competition attract athletes who want an urban college experience with professional possibilities.
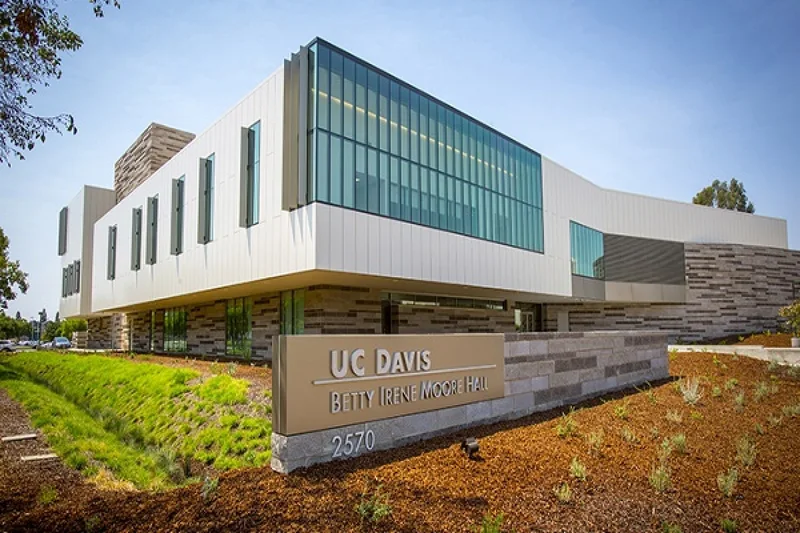

University of California, Davis
Davis, CA
Research opportunities, competitive athletics and a bike-friendly college town give recruits distinct reasons to consider this campus.


University of California, Los Angeles
Los Angeles, CA
Strong academics, major conference competition and Los Angeles career opportunities appeal to ambitious student-athletes.


California State University, Fresno
Fresno, CA
Competitive athletics, career-focused programs and affordable costs draw athletes who want strong connections to the Central Valley.
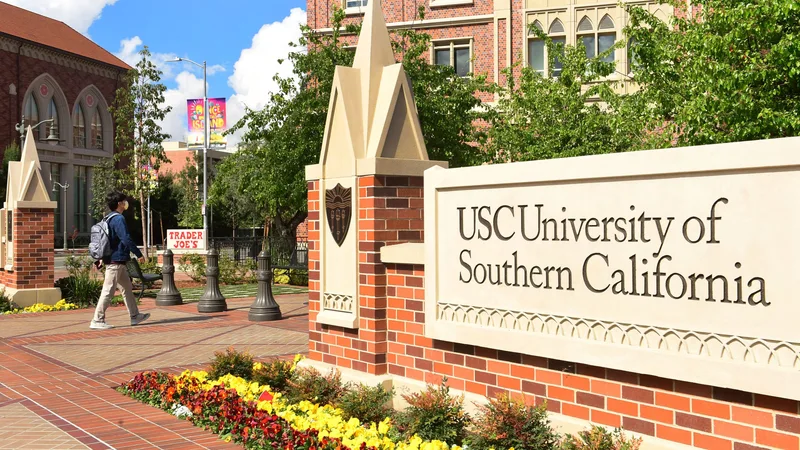

University of Southern California
Los Angeles, CA
Competitive athletics, strong professional programs and Los Angeles industry connections give recruits compelling reasons to pursue a place here.
Roster openings · 2026-27
Which D1 Football programs have the most roster spots opening up?
Every program ranked by players in their final year, with the positions they are losing.
29.7players leaving per program, on average
See the programs Three ways to start
Where are you in the search?
Pick the option that matches where you are, and we will show you the plan that fits.
Recruiting Plan
Your 20 to 25 best-fit schools, picked for you.



- Starter: the list, fit reads, real costs and a dated timeline
- Complete: adds roster reads and coach emails for every school
$99 or $249Starter or Complete, one time
Build my plan
Roster Report
The roster at your position, at the schools you pick.


- Who is graduating at your position, class year by class year
- Where spots are likely to open, in plain words
From $193, 8 or 15 schools
Choose my schools
School Plan
One school, covered end to end.
- Your honest odds, the roster and the verified coach
- Intro email, three follow-ups, admissions steps and timeline
$49One school, one time
Pick my school Resources