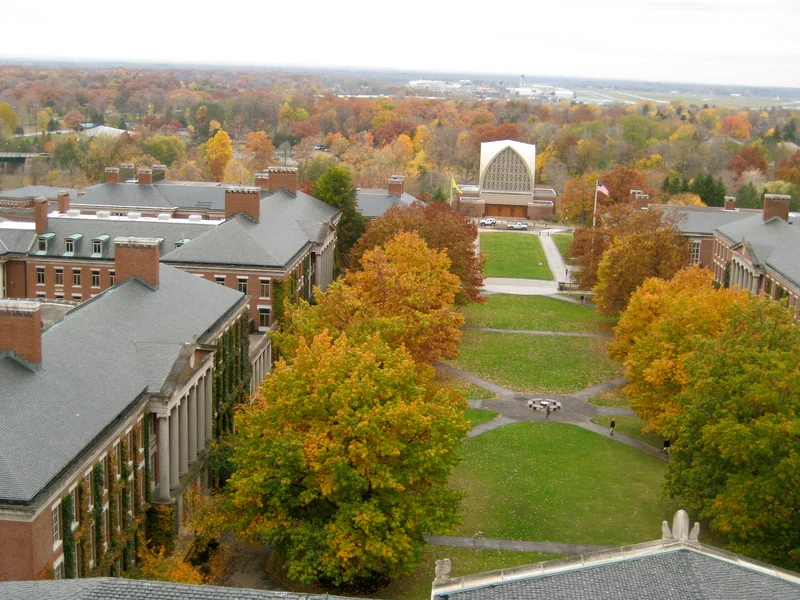

Flexible academic choices and research opportunities appeal to athletes who want serious study alongside competitive athletics.

NCAA Division IIILiberty LeagueNew York

Rensselaer Polytechnic Institute Women's Lacrosse
One plan built for Rensselaer Polytechnic Institute Women's Lacrosse, with the roster read, the coach's contact and a dated plan, delivered within 24 hours. An expert checks every plan.
- 25
- Roster
- 28%
- In-state
Overview
Rensselaer Polytechnic Institute Women's Lacrosse Team Details
Key facts about the Rensselaer Polytechnic Institute women's lacrosse team.
Based in Troy, New York, Rensselaer Polytechnic Institute competes in the Liberty League at the Division III level in women's lacrosse. Its lowest year of the last five by winning percentage came in 2026, at 6-9. It recruits widely, and no state supplies more than 28% of the roster.
NCAA Division IIILiberty LeagueNew York
- Head coach
- Erica Blubaugh
- Home venue
- ECAV Stadium
- Average roster
- 25
- Five-year win rate
- 57%
Acting Head Coach
players a season
Fit check
Do You Fit at Rensselaer Polytechnic Institute?
Pick your position and level, add a test score if you have one, and get an instant read on your chances here. Free, and no account needed.
Coaching staff
Get on This Staff's Radar
Head coach
Erica BlubaughActing Head CoachEmail●●●●●●@●●●●.edu
Phone(●●●) ●●●-●●●●
Roster
Roster Breakdown
The roster by class
8FreshmenFr.
7SophomoresSo.
6JuniorsJr.
3SeniorsSr.
24 players on the latest roster (2026).
Positions
Women's Lacrosse Roster by Position
How many players a season the program carries at each position, and how tall they are.
Attack
5.3players a season
Average height 5'5"
Midfield
9players a season
Average height 5'7"
Defense
7players a season
Average height 5'6"
Goalie
3.7players a season
Average height 5'4"
Coaches carry a lot of goalies, about four per season, or 15% of the roster, compared with 10% for the average team among Division III women's lacrosse teams. Roster spots lean away from attackers, which fill 21% of the roster versus 29% on the average Division III women's lacrosse team.
Footprint
Where This Team Recruits
Where the players are from
75players
In-state28%
Other US states72%
International0%
Counted from players on recent rosters with a known hometown.
Top home states
New York28%
Pennsylvania12%
New Hampshire9%
Massachusetts9%
New Jersey8%
All five of the leading states each supply at least 5% of players, yet together they make up just 67% of the roster, versus a median of 89% among Division III women's lacrosse teams. Coaches here recruit well beyond one region, so location is less of a barrier for recruits.
Results
Rensselaer Polytechnic Institute Women's Lacrosse Recent Results
Swipe to see every season
2022
69%11-5overall
7-3conference
Best season
2023
69%11-5overall
6-4conference
2024
50%8-8overall
6-4conference
2025
56%9-7overall
6-4conference
Latest
2026
40%6-9overall
3-7conference
Win rate fell to 40% in the 2026 season, a 6-9 finish and the lowest of the last five seasons.
Standings
Liberty League Standings
Where Rensselaer Polytechnic Institute stands in the Liberty League.
Schedule and travel
Women's Lacrosse Schedule
The season's games, home and away, and how far the team travels.
Recruiting
Recruiting Outlook
Who fits this program
- Competes within NCAA Division III Liberty League structure
- Demands strong academic discipline alongside lacrosse training
- Located on a medium-sized suburban campus in Troy, NY
- Suited for lacrosse players comfortable with STEM-focused, rigorous culture
Program stats
The Program by the Numbers
26
Athletes on the roster
2
Coaches on staff
$2,538
Spent per athlete
Spending and revenue a year
Spending$177,050
Revenue$195,703
Revenue covers everything the program spends.
According to the 2025 EADA report, 26 athletes share two coaches, about 13 athletes per coach and above the median of eight among Division III women's lacrosse teams.
Source: the federal Equity in Athletics report, 2025.
Feeders
Top Feeder Schools and Clubs
The high schools and clubs that sent the most players to this roster.
Recent rosters include three players from Shenendehowa High School, the most of any single school or club, ahead of Bedford High School with two.
The school
School Environment
Rensselaer Polytechnic Institute's engineering and technology focus shapes an academic experience where course rigor, faculty access, major selection and career outcomes matter alongside your commitment to competing in college.
 Rensselaer Polytechnic InstituteTroy, New YorkSee the full profile
63%
Acceptance rate
84%
Graduation rate
- Undergraduates
- 5,741
- Net price a year
- $36,228
- Earnings after ten years
- $102,051
Official links
Official Rensselaer Polytechnic Institute Women's Lacrosse Links
Similar programs
Similar Lacrosse Teams
Programs at a similar level, with similar academics, worth adding to your recruiting list.
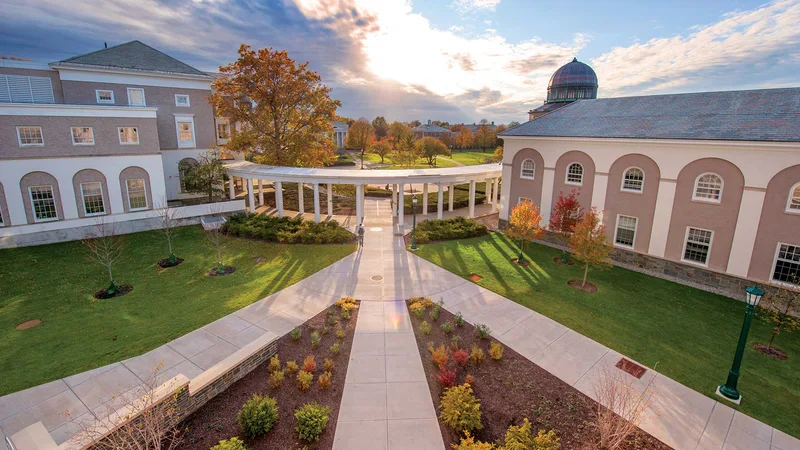

Engineering, close faculty relationships and a residential campus with city access give athletes distinct reasons to consider Union.
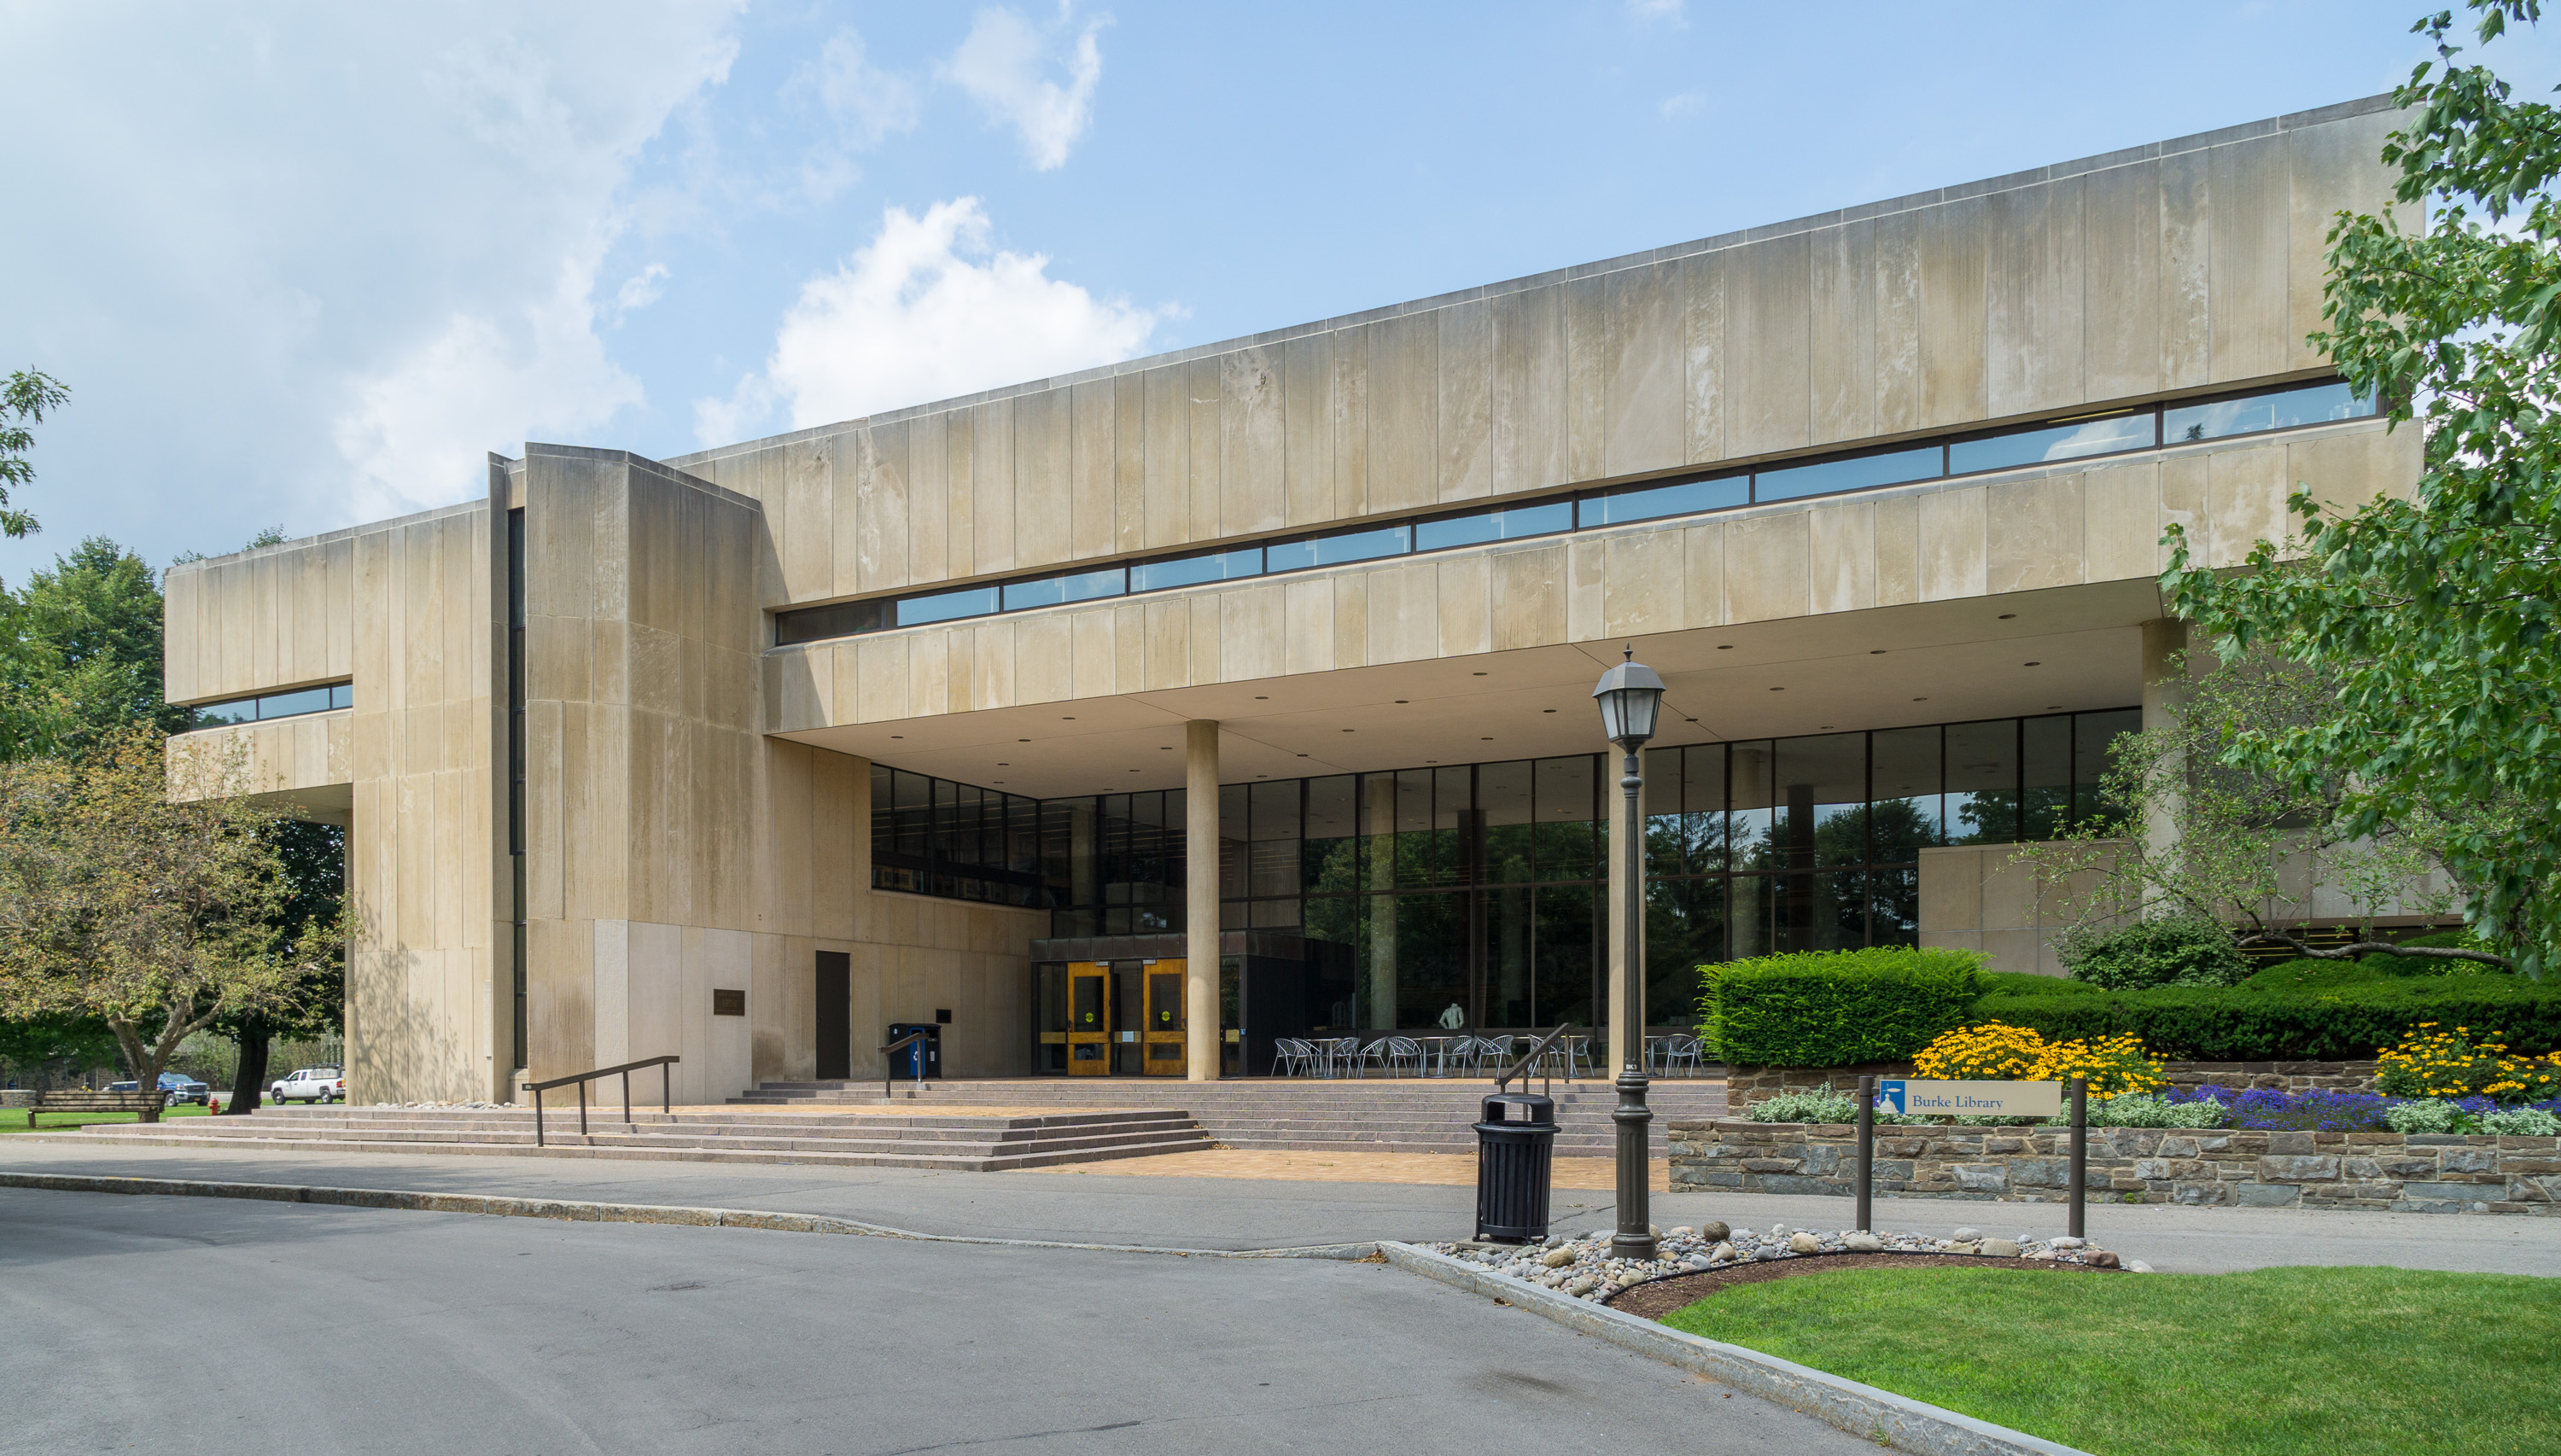
An open curriculum, close faculty connections and competitive NESCAC athletics appeal to academically driven recruits.
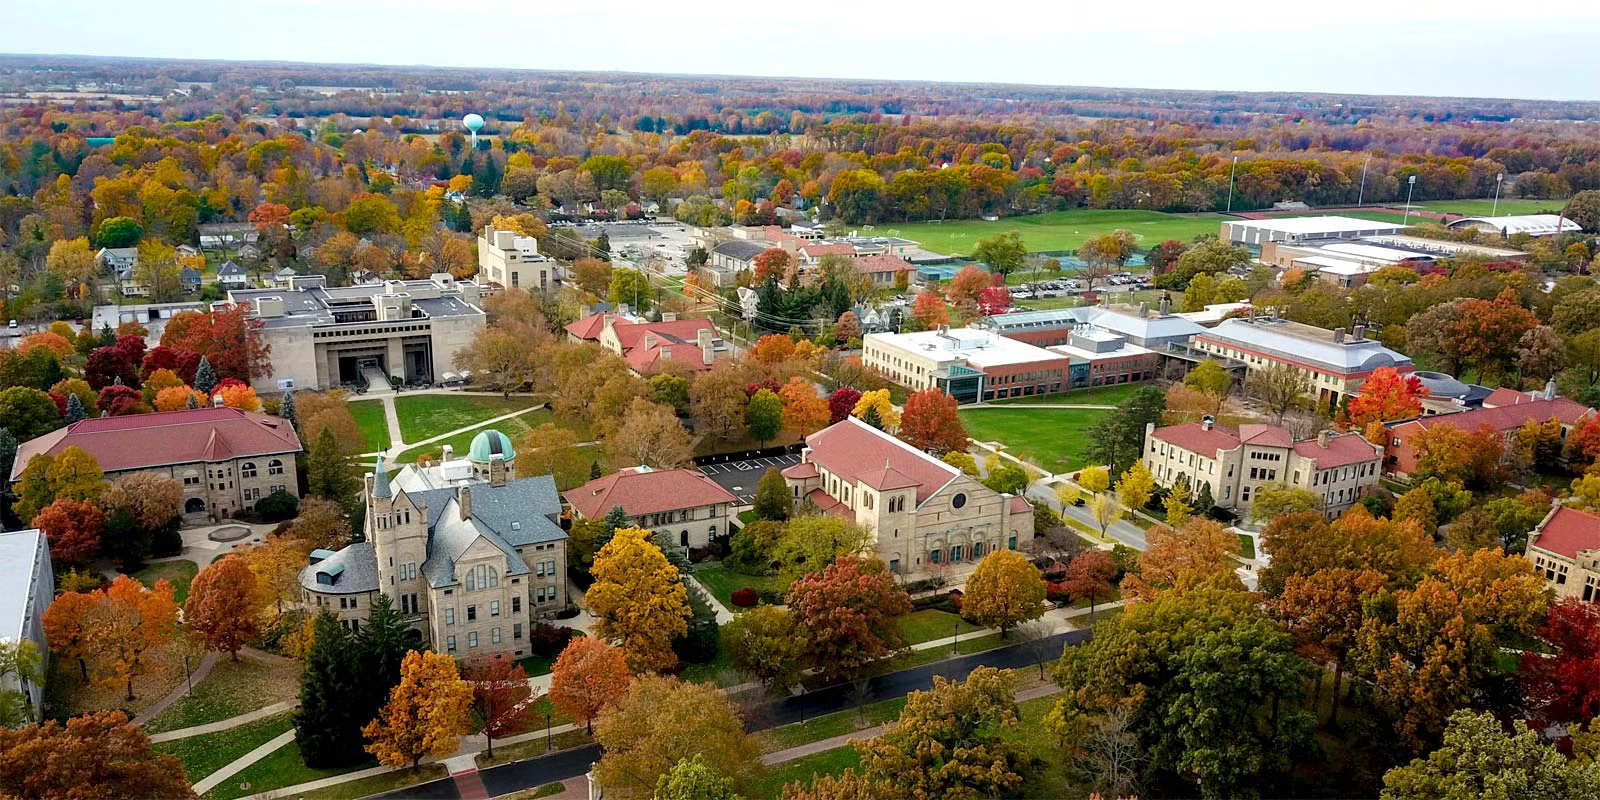

Athletes choose Oberlin for demanding academics, close faculty relationships and a campus shaped by music and activism.
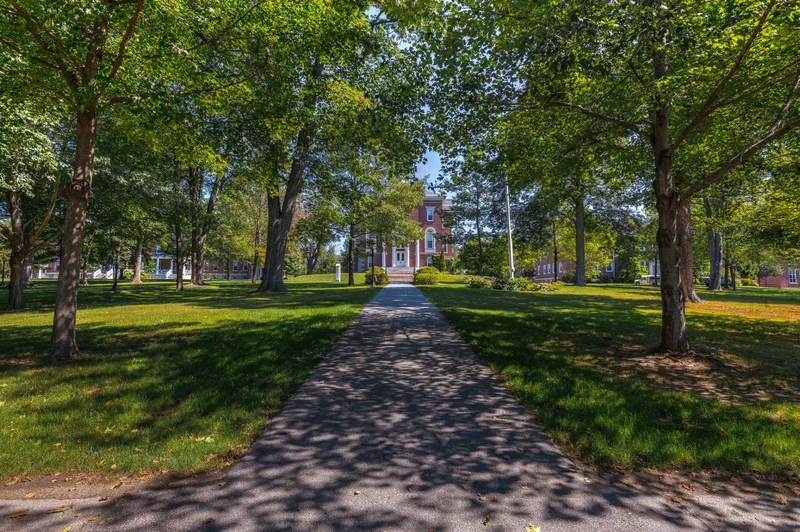

Close faculty connections and a collaborative campus culture complement demanding academics and competitive NESCAC athletics.


Close faculty relationships and Los Angeles opportunities complement a residential liberal arts experience and Division III competition.
Teams in New York
More Lacrosse Teams in New York


Alfred State College
Alfred, NY
Hands-on academics, SUNY affordability and a small residential community give athletes practical reasons to pursue this campus.
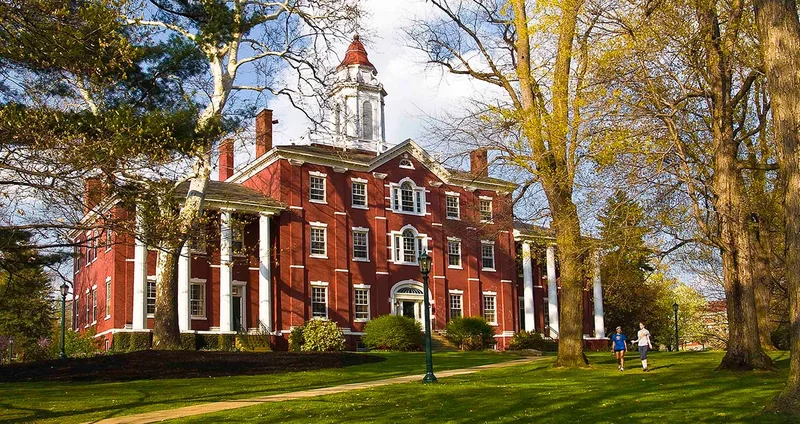

Alfred University
Alfred, NY
Small classes, hands-on academics and Division III competition appeal to athletes seeking a close-knit residential college experience.


Bard College
Annandale-on-Hudson, NY
Athletes choose a setting where challenging liberal arts study, close faculty relationships and competition can fit together.


Elmira College
Elmira, NY
Close faculty connections and a small campus help athletes build an academic identity alongside their sport.
Hamilton College
Clinton, NY
An open curriculum, close faculty connections and competitive NESCAC athletics appeal to academically driven recruits.


Hartwick College
Oneonta, NY
Close faculty relationships, experiential learning and Division III competition give athletes a connected college experience.
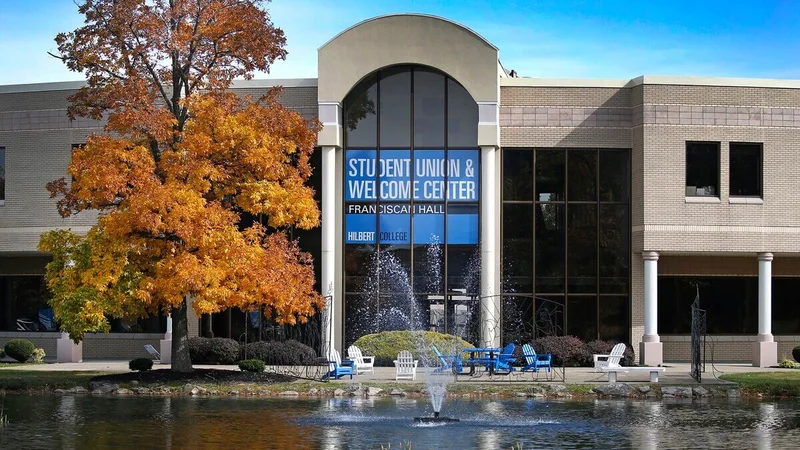
Hilbert College
Hamburg, NY
Career-focused majors, accessible admissions and a close-knit campus give athletes practical reasons to consider competing here.


Hobart and William Smith Colleges
Geneva, NY
Athletes come for competitive programs, close faculty relationships and a residential community with strong career preparation.


Ithaca College
Ithaca, NY
Competitive athletics, hands-on academics and close mentoring appeal to recruits who want a connected college experience.

Keuka College
Keuka Park, NY
A close-knit lakeside community and hands-on academics appeal to athletes seeking personal connections alongside competitive athletics.


Manhattanville University
Purchase, NY
Athletes can combine competitive conference play with accessible admissions, close faculty contact and a contained residential campus.
Roster openings
Which D3 Women's Lacrosse programs have the most roster spots opening up?
Every program ranked by players in their final year, with the positions they are losing.
5players leaving per program, on average
See the programs Three ways to start
Where are you in the search?
Pick the option that matches where you are, and we will show you the plan that fits.
Recruiting Plan
Your 20 to 25 best-fit schools, picked for you.



- Starter: the list, fit reads, real costs and a dated timeline
- Complete: adds roster reads and coach emails for every school
$99 or $249Starter or Complete, one time
Build my plan
Roster Report
The roster at your position, at the schools you pick.


- Who is graduating at your position, class year by class year
- Where spots are likely to open, in plain words
From $193, 8 or 15 schools
Choose my schools
School Plan
One school, covered end to end.
- Your honest odds, the roster and the verified coach
- Intro email, three follow-ups, admissions steps and timeline
$49One school, one time
Pick my school Resources
Additional Resources
Pathley Lacrosse hubRankings, divisions and programsLacrosse recruiting timelineWhat to do each year of high schoolHow coaches evaluate college lacrosseWhat coaches look for at this levelThe lacrosse recruiting guideContact rules, emails and costsEvery D3 Women's Lacrosse programThe full list, with filters