

Career-focused programs, accessible admissions and regional Division III competition give athletes practical reasons to consider this campus.
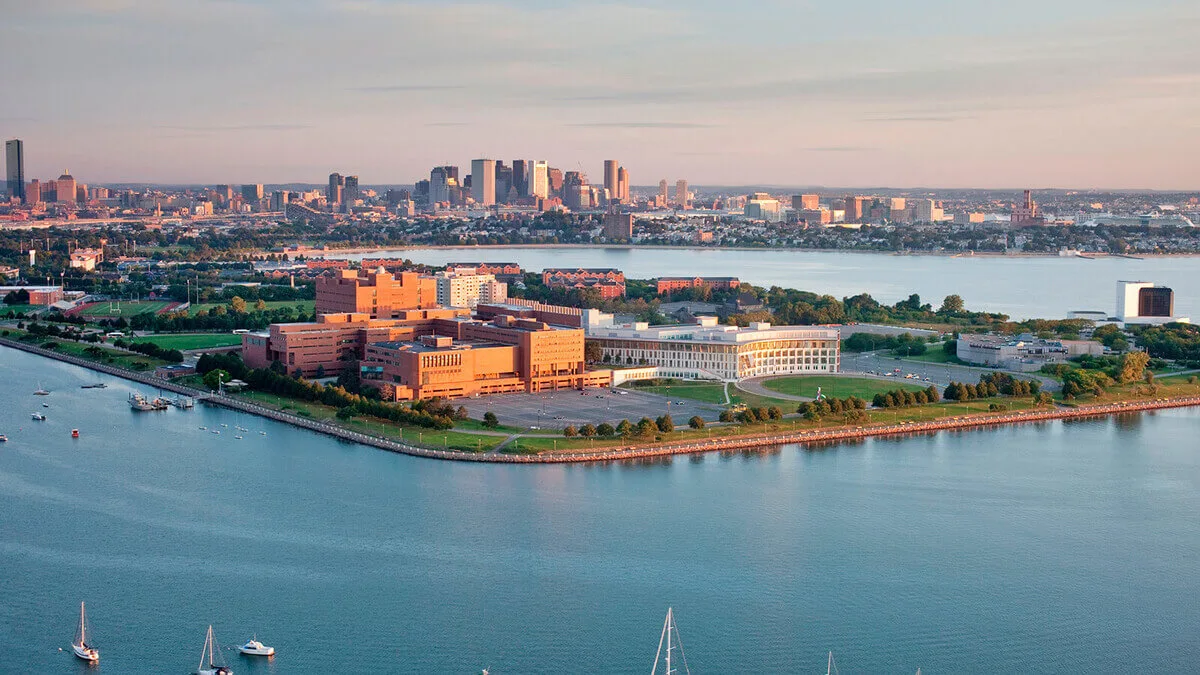
NCAA Division IIILittle East ConferenceMassachusetts

University of Massachusetts Boston Women's Soccer
One plan built for University of Massachusetts Boston Women's Soccer, with the roster read, the coach's contact and a dated plan, delivered within 24 hours. An expert checks every plan.
- 26
- Roster
- 5
- Leaving
- 41%
- In-state
- 0%
- Transfers
Overview
University of Massachusetts Boston Women's Soccer Team Details
Key facts about the University of Massachusetts Boston women's soccer team.
Based in Boston, Massachusetts, University of Massachusetts Boston competes in the Little East Conference at the Division III level in women's soccer. The most room for the Class of 2027 is among defenders, with three leaving after the 2026-27 season.
NCAA Division IIILittle East ConferenceMassachusetts
- Head coach
- Amy Zombeck
- Home venue
- James Cotter Field
- Average roster
- 30
- Five-year win rate
- 58%
Head Women's Soccer Coach
players a season
Fit check
Do You Fit at University of Massachusetts Boston?
Pick your position and level, add a test score if you have one, and get an instant read on your chances here. Free, and no account needed.
Coaching staff
Get on This Staff's Radar
Head coach
Amy ZombeckHead Women's Soccer CoachEmail●●●●●●@●●●●.edu
Phone(●●●) ●●●-●●●●
Roster
Roster Breakdown
The roster by class
5FreshmenFr.
11SophomoresSo.
5JuniorsJr.
5SeniorsSr.
26 players on the latest roster (2026).
Roster openings after 2026-27
5players in their final year, 19% of the roster
Defender 3 · Midfielder 1 · Forward 1
After the 2026-27 season, three defenders will leave, the largest group of departures by position. Players at that position have the clearest chance to step into new roles.
See who you would be replacingPositions
Women's Soccer Roster by Position
How many players a season the program carries at each position, and how tall they are.
Goalkeeper
3.3players a season
Average height 5'6"
Defender
9.7players a season
Average height 5'6"
Midfielder
6.7players a season
Average height 5'5"
Forward
10players a season
Average height 5'4"
A light midfielders group stands out, at 23% of the roster versus 34% for the average Division III women's soccer team. At 34% of the roster, forwards outnumber what the average Division III women's soccer team carries, which is 24%.
Footprint
Where This Team Recruits
Where the players are from
86players
In-state40.7%
Other US states55.8%
International3.5%
Counted from players on recent rosters with a known hometown.
Top home states
Massachusetts41%
Connecticut16%
New Hampshire7%
Rhode Island5%
Colorado5%
The newest class has no one from Massachusetts among its five freshmen with a listed hometown, while 36% of the current roster is from there. No single state dominates, with the five biggest supplying just 73% of players, versus a median of 88% among Division III women's soccer teams.
Results
University of Massachusetts Boston Women's Soccer Recent Results
Swipe to see every season
2021
67%13-6-2overall
6-1-1conference
2022
50%9-9-2overall
5-3conference
2023
55%7-5-9overall
3-1-4conference
Best season
2024
68%11-4-5overall
6-1-1conference
Latest
2025
50%8-8-3overall
4-3-1conference
Win rate fell 18 points, from 68% in 2024 to 50% in 2025, with the record going from 11-4-5 to 8-8-3.
Standings
Little East Conference Standings
Where University of Massachusetts Boston stands in the Little East Conference.
Schedule and travel
Women's Soccer Schedule
The season's games, home and away, and how far the team travels.
Recruiting
Recruiting Outlook
Who fits this program
- NCAA Division III competition emphasizing balanced athletics
- Moderate academic rigor supports focused student-athletes
- Urban campus with diverse culture and commuter access
- Women soccer players who manage city life and time well
Program stats
The Program by the Numbers
31
Athletes on the roster
4
Coaches on staff
$1,772
Spent per athlete
Spending and revenue a year
Spending$209,034
Revenue$214,708
Revenue covers everything the program spends.
At about $2,200 per athlete in the 2025 EADA report, operating spending runs about 44% above the Division III median.
Source: the federal Equity in Athletics report, 2025.
Feeders
Top Feeder Schools and Clubs
The high schools and clubs that sent the most players to this roster.
1Belchertown High2 players on recent rosters
2Heritage Academy2 players on recent rosters
3Nashoba Regional2 players on recent rosters
4Oliver Ames High2 players on recent rosters
5West Port High School2 players on recent rosters
Recruiting runs through several pipelines, as five sources have placed two or more players across recent rosters, including Belchertown High.
The school
School Environment
University of Massachusetts Boston combines research opportunities with strengths in science, management and health fields, giving recruits a useful framework for weighing academic demands, faculty access and potential career paths.
University of Massachusetts BostonBoston, MassachusettsSee the full profile 84%
Acceptance rate
49%
Graduation rate
- Undergraduates
- 12,138
- Net price a year
- $17,707
- Earnings after ten years
- $65,865
Official links
Official University of Massachusetts Boston Women's Soccer Links
Similar programs
Similar Soccer Teams
Programs at a similar level, with similar academics, worth adding to your recruiting list.


A small residential community and undergraduate-focused teaching give athletes a personal setting for balancing academics and competition.


Career-focused programs, accessible admissions and a small campus community give athletes clear reasons to consider competing here.


Downtown Boston access and professionally focused academics appeal to athletes who want competition alongside career preparation.

Personalized instruction, health sciences strengths and a suburban location give athletes practical reasons to consider Carroll.
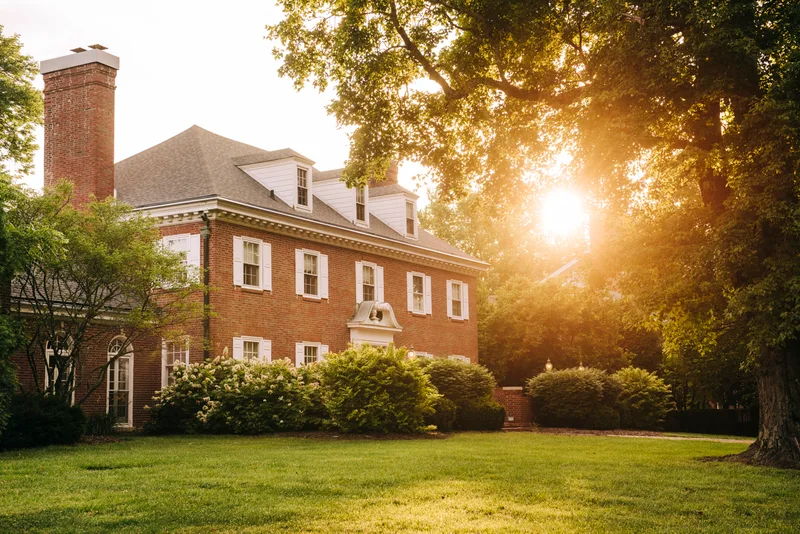

Close faculty mentorship and a riverside campus appeal to athletes seeking a small-college experience alongside conference competition.
Teams in Massachusetts
More Soccer Teams in Massachusetts


Amherst College
Amherst, MA
Athletes choose Amherst for demanding academics, close faculty relationships and competitive athletics within a small residential community.


Babson College
Wellesley, MA
Athletes choose Babson for competitive athletics, entrepreneurial learning, a close-knit community and strong business career outcomes.


Brandeis University
Waltham, MA
Close faculty relationships, undergraduate research and competitive athletics appeal to students who want substantial academic and athletic commitments.


Bridgewater State University
Bridgewater, MA
Accessible admissions, career-focused programs and public tuition give athletes practical reasons to consider competing here.


Clark University
Worcester, MA
Research opportunities, close faculty connections and NEWMAC competition give athletes a clear mix of academic and athletic priorities.


Curry College
Milton, MA
A small residential community and individualized academic support appeal to athletes balancing coursework with competition.


Dean College
Franklin, MA
Accessible admissions, supportive academics and a small residential community give athletes practical reasons to consider competing here.


Emerson College
Boston, MA
Athletes choose a specialized creative education, competitive conference play and daily access to downtown Boston.
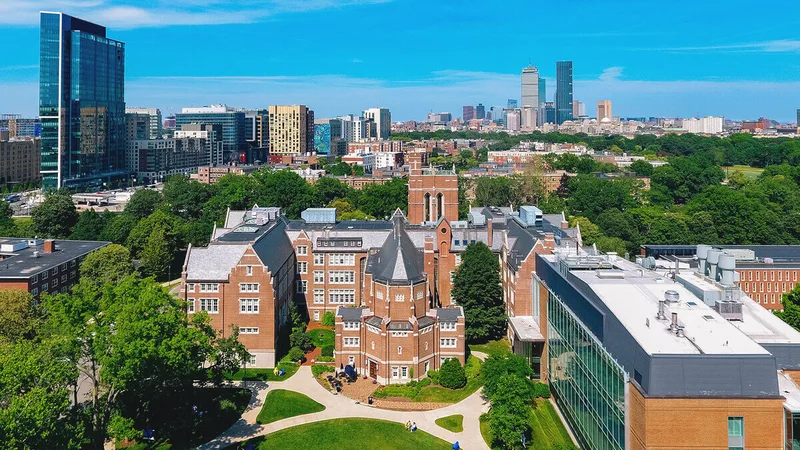

Emmanuel College
Boston, MA
Athletes choose a close-knit campus where Division III competition meets career preparation and Boston internship opportunities.
Roster openings · 2026-27
Which D3 Women's Soccer programs have the most roster spots opening up?
Every program ranked by players in their final year, with the positions they are losing.
6players leaving per program, on average
See the programs Three ways to start
Where are you in the search?
Pick the option that matches where you are, and we will show you the plan that fits.
Recruiting Plan
Your 20 to 25 best-fit schools, picked for you.



- Starter: the list, fit reads, real costs and a dated timeline
- Complete: adds roster reads and coach emails for every school
$99 or $249Starter or Complete, one time
Build my plan
Roster Report
The roster at your position, at the schools you pick.


- Who is graduating at your position, class year by class year
- Where spots are likely to open, in plain words
From $193, 8 or 15 schools
Choose my schools
School Plan
One school, covered end to end.
- Your honest odds, the roster and the verified coach
- Intro email, three follow-ups, admissions steps and timeline
$49One school, one time
Pick my school Resources