

Division I competition, marine science strengths and in-state value give athletes distinct reasons to consider Kingston.
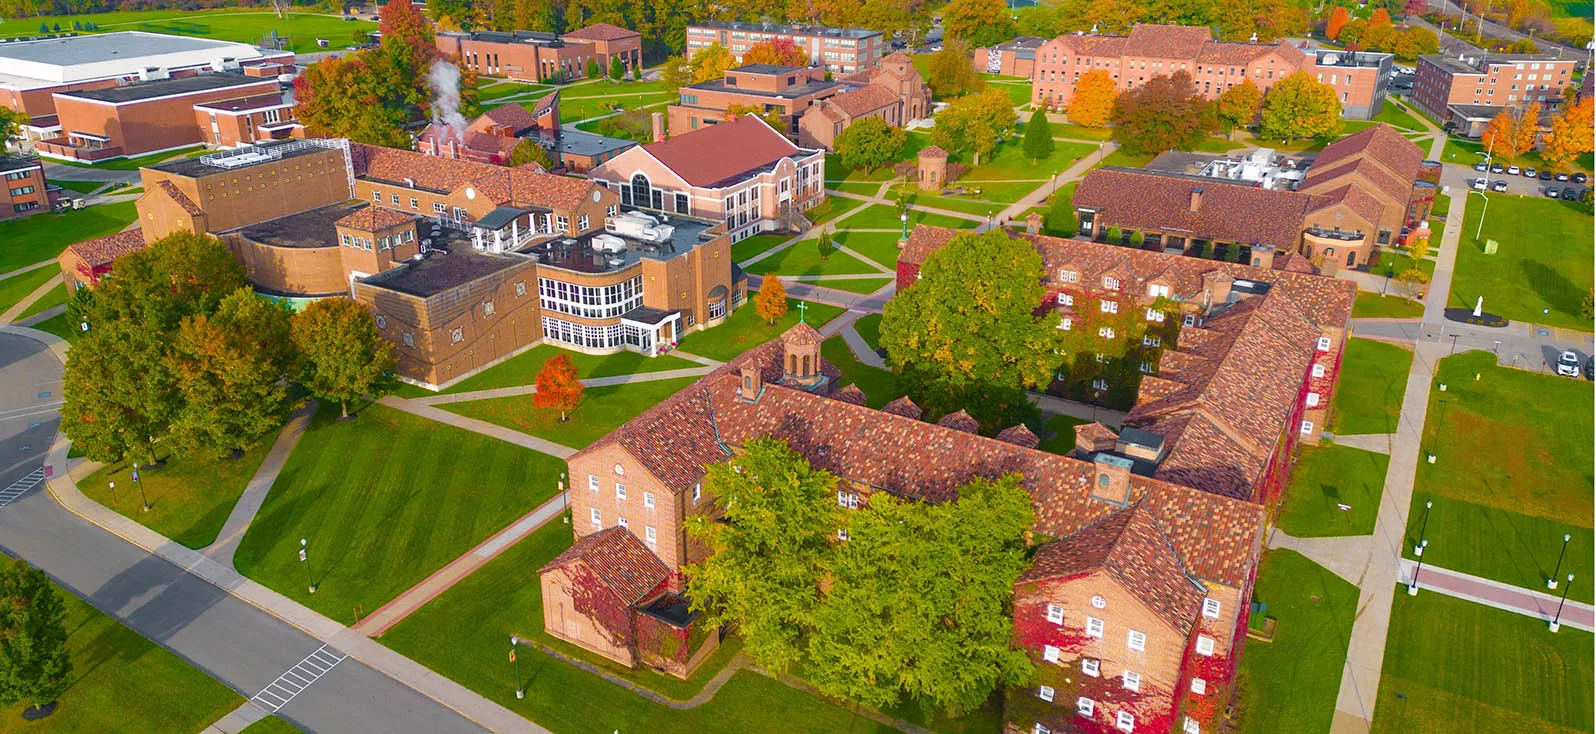
NCAA Division IAtlantic 10 ConferenceNew York

St. Bonaventure University Baseball
One plan built for St. Bonaventure University Baseball, with the roster read, the coach's contact and a dated plan, delivered within 24 hours. An expert checks every plan.
- 33
- Roster
- 9
- Leaving
- 33%
- In-state
- 15%
- Transfers
Overview
St. Bonaventure University Baseball Team Details
Key facts about the St. Bonaventure University baseball team.
Based in St. Bonaventure, New York, St. Bonaventure University competes in the Atlantic 10 Conference at the Division I level in baseball. After the 2026-27 season, it loses four pitchers, the most of any position group, followed by two infielders. Only 35% of last season's non-seniors returned, which marks high turnover among Division I baseball teams.
NCAA Division IAtlantic 10 ConferenceNew York
- Head coach
- Jason Rathbun
- Home venue
- Handler Park at McGraw-Jennings Field
- Average roster
- 36
- Five-year win rate
- 27%
Head Baseball Coach
players a season
Fit check
Do You Fit at St. Bonaventure University?
Pick your position and level, add a test score if you have one, and get an instant read on your chances here. Free, and no account needed.
Coaching staff
Get on This Staff's Radar
Head coach
Jason RathbunHead Baseball CoachEmail●●●●●●@●●●●.edu
Phone(●●●) ●●●-●●●●
Roster
Roster Breakdown
The roster by class
8FreshmenFr.
6SophomoresSo.
10JuniorsJr.
5SeniorsSr.
4GraduateGrad
33 players on the latest roster (2027).
Roster openings after 2026-27
9players in their final year, 27% of the roster
Pitcher 4 · Catcher 1 · Infielder 2 · Outfielder 2
After the 2026-27 season, four pitchers will leave, the largest group of departures by position, followed by two infielders. Recruits at those positions would face the least entrenched competition.
See who you would be replacingThe program has kept only 35% of last season's non-seniors, below the 61% median among Division I baseball teams, and has 14 transfers on the current roster, a high count among Division I baseball teams. With that much movement, new players may have a real shot at roster spots.
Positions
Baseball Roster by Position
How many players a season the program carries at each position, and how tall they are.
Pitcher
17players a season
Average height 6'2"
Catcher
4players a season
Average height 6'2"
Infielder
8.3players a season
Average height 6'2"
Outfielder
5.7players a season
Average height 6'1"
Utility/Designated Hitter
0.7players a season
Average height 5'11"
Transfers
Transfers In and Out
5
transfers in for 2026-27
4
transfers out
- Share of the roster
- 15%
- Per 100 freshmen
- 63
- By position
- Pitcher 2 · Catcher 1 · Infielder 1 · Outfielder 1
- Came from
- 3 from Division I, 2 from Division II
Footprint
Where This Team Recruits
Where the players are from
105players
In-state33.3%
Other US states55.2%
International11.4%
Counted from players on recent rosters with a known hometown.
Top home states
New York33%
Pennsylvania17%
Colorado6%
Massachusetts5%
Virginia4%
International players make up 11% of the roster, in the top 10% among Division I baseball teams, where the median is 1%, including several from Canada and Japan. Recruiting is spread thin geographically, since even the top five states combine for 65% of the roster, compared with a median of 78% among Division I baseball teams.
Results
St. Bonaventure University Baseball Recent Results
Swipe to see every season
2022
11%5-39overall
3-21conference
2023
17%8-40overall
5-19conference
2024
37%18-31overall
8-16conference
Best season
2025
41%20-29overall
11-19conference
Latest
2026
27%13-36-1overall
7-23conference
A win rate of 27% over the last five seasons ranks in the bottom 10% among Division I baseball teams, behind the 49% median.
Schedule and travel
Baseball Schedule
The season's games, home and away, and how far the team travels.
Recruiting
Recruiting Outlook
St. Bonaventure baseball competes at the NCAA Division I level in the Atlantic 10, where athletes face a strong conference schedule and a competitive path to playing time. The program has an established history that includes an Atlantic 10 tournament championship and NCAA Tournament appearance, while its current roster shows a mix of high school recruits, junior college transfers and four-year transfers.
NCAA Division I Atlantic 10 competitionRoster built through high school and transfer recruitingCurrent emphasis on contending for the A-10 Tournament
Recruiting difficulty
60/ 100Hard
OpenCompetitiveSelectiveElite
It is a competitive Division I program where most roster spots require demonstrated college-level tools, production or projectable development.
What coaches value
- Reliable defensive ability and positional versatility across the diamond
- Pitchers with repeatable mechanics, command and at least one dependable secondary pitch
- Game-ready offensive tools, including bat speed, strike-zone control and situational hitting
- Athleticism, coachability and academic preparation for a demanding Division I schedule
How to get recruited here
Build a concise recruiting profile with verified video, current measurements, position-specific statistics and academic information. Contact the baseball staff early, attend reputable showcases or camps, and explain how your tools fit the program's needs, especially if you can offer defensive versatility, pitching depth or a clear offensive skill.
How hard is it to make the team
Making this team is moderately difficult because St. Bonaventure competes in Division I and uses a roster that includes recruited high school players and experienced junior college or four-year transfers. Walk-on opportunities may exist, but athletes should expect meaningful competition for roster and playing opportunities and should present a clear, coachable development path.
Who fits this program
- Baseball players seeking competitive NCAA Division I opportunities
- Athletes prepared to balance structured baseball commitments with coursework
- Students preferring a small, rural, residential campus setting
- Players prepared to develop within varied recruiting pathways
Program stats
The Program by the Numbers
41
Athletes on the roster
3
Coaches on staff
$7,322
Spent per athlete
Spending and revenue a year
Spending$930,962
Revenue$930,962
Revenue covers everything the program spends.
Staffing is lean relative to roster size, with three coaches for 41 athletes in the 2025 EADA report, roughly 14 athletes per coach versus a median of 10 among Division I baseball teams.
Source: the federal Equity in Athletics report, 2025.
Feeders
Top Feeder Schools and Clubs
The high schools and clubs that sent the most players to this roster.
1Central Catholic High School2 players on recent rosters2Downers Grove North2 players on recent rosters
3Salamanca High School2 players on recent rosters
4Webster-Schroeder High School2 players on recent rostersRepeat pipelines are common here, with Central Catholic High School, Downers Grove North, and Salamanca High School each showing up with at least two players.
The school
School Environment
St. Bonaventure University combines a Franciscan liberal arts core with strengths in communication, business and health professions, making academic fit about both career preparation and balancing coursework with competition.
St. Bonaventure UniversitySt. Bonaventure, New YorkSee the full profile 82%
Acceptance rate
67%
Graduation rate
- Undergraduates
- 2,042
- Net price a year
- $27,074
- Earnings after ten years
- $57,214
Official links
Official St. Bonaventure University Baseball Links
Similar programs
Similar Baseball Teams
Programs at a similar level, with similar academics, worth adding to your recruiting list.
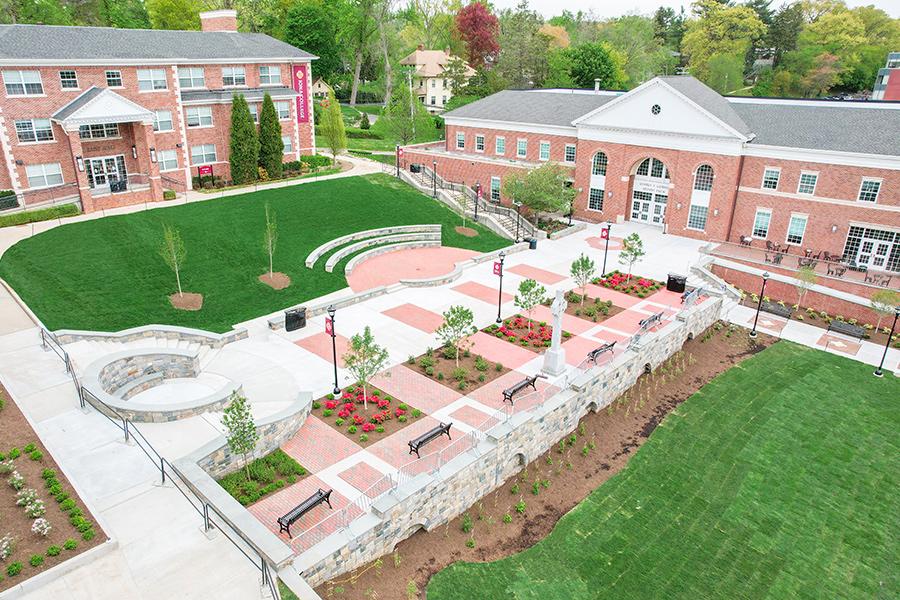

Athletes come for competitive athletics, a close-knit community and career preparation connected to nearby New York City.


A close-knit campus and career-focused learning give athletes a personal setting for pursuing demanding competition.
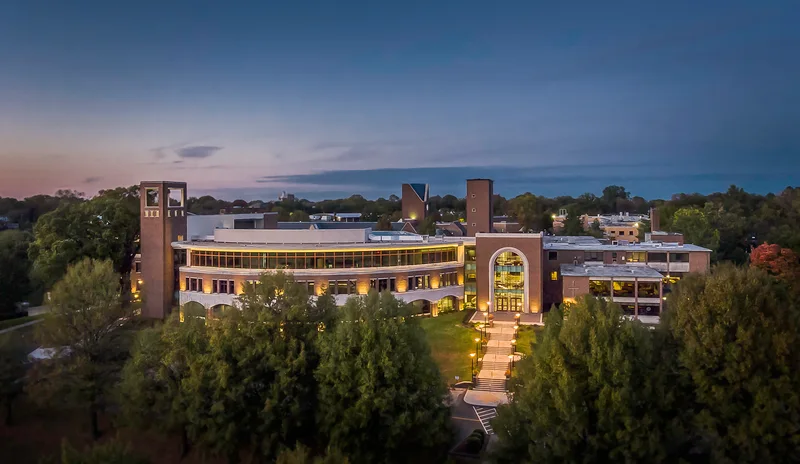

Personal instruction, career-focused programs and Louisville opportunities give athletes reasons to look beyond the competition schedule.


Career-focused study, accessible admissions and New York professional connections complement the demands of Division I competition.


Close faculty relationships and city-based learning opportunities complement a small residential campus with Division I competition.
Teams in New York
More Baseball Teams in New York
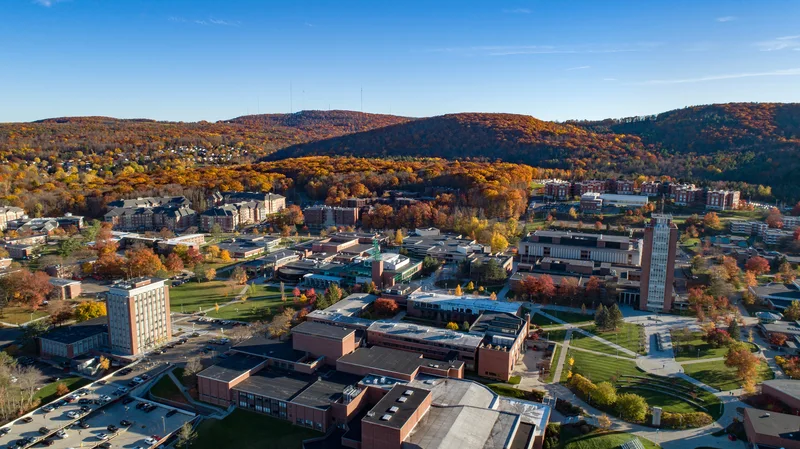

Binghamton University
Vestal, NY
Strong academics, research opportunities and an active residential campus give athletes reasons to look beyond their sport.


Canisius University
Buffalo, NY
Close faculty access and career-focused academics give athletes a personal foundation for balancing Division I competition.
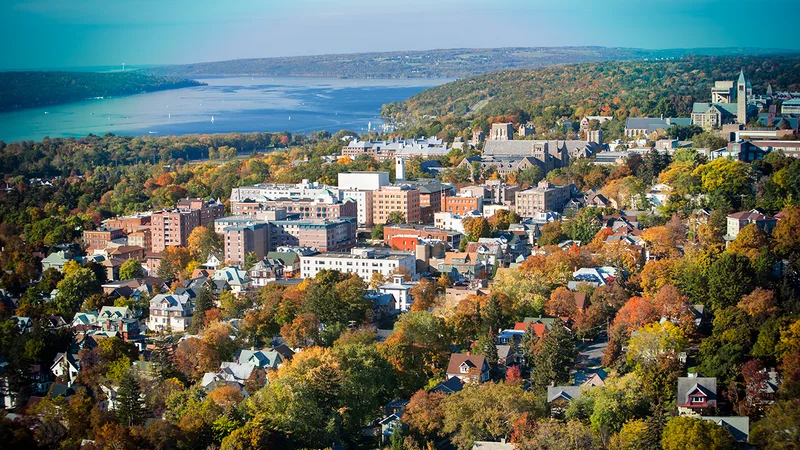

Cornell University
Ithaca, NY
Ivy League competition, research opportunities and a residential campus appeal to athletes seeking an academically demanding experience.


Columbia University in the City of New York
New York, NY
Ivy League competition, demanding academics and New York City opportunities appeal to athletes with broad ambitions.


Fordham University
New York, NY
Competitive athletics, business-focused academics and New York City career access give recruits distinct reasons to consider Fordham.


Hofstra University
Hempstead, NY
Competitive athletics, professional programs and nearby New York City give recruits several reasons to consider this campus.
Iona University
New Rochelle, NY
Athletes come for competitive athletics, a close-knit community and career preparation connected to nearby New York City.
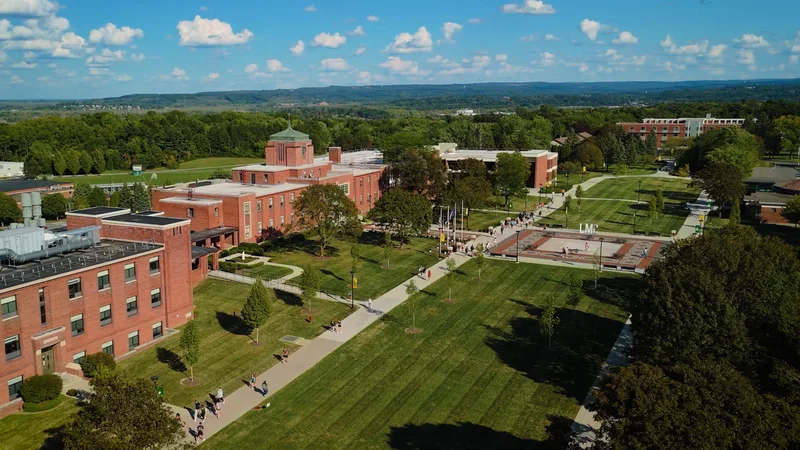

Le Moyne College
Syracuse, NY
A small college community, accessible admissions and career-focused academics complement the demands of Division I competition.
Long Island University
Brooklyn, NY
Career-focused study, accessible admissions and New York professional connections complement the demands of Division I competition.


Manhattan University
Riverdale, NY
Athletes choose a small-campus community that pairs competitive athletics with career-focused study and New York City opportunities.


Marist University
Poughkeepsie, NY
Competitive athletics, career-focused academics and a residential Hudson River setting give recruits distinct reasons to consider studying here.
Niagara University
Lewiston, NY
A close-knit campus and career-focused learning give athletes a personal setting for pursuing demanding competition.
Roster openings · 2026-27
Which D1 Baseball programs have the most roster spots opening up?
Every program ranked by players in their final year, with the positions they are losing.
10.2players leaving per program, on average
See the programs Three ways to start
Where are you in the search?
Pick the option that matches where you are, and we will show you the plan that fits.
Recruiting Plan
Your 20 to 25 best-fit schools, picked for you.



- Starter: the list, fit reads, real costs and a dated timeline
- Complete: adds roster reads and coach emails for every school
$99 or $249Starter or Complete, one time
Build my plan
Roster Report
The roster at your position, at the schools you pick.


- Who is graduating at your position, class year by class year
- Where spots are likely to open, in plain words
From $193, 8 or 15 schools
Choose my schools
School Plan
One school, covered end to end.
- Your honest odds, the roster and the verified coach
- Intro email, three follow-ups, admissions steps and timeline
$49One school, one time
Pick my school Resources