

Research opportunities, Big East competition and a lively residential campus give athletes compelling reasons to consider studying here.

NCAA Division IIndependentMassachusetts

Merrimack College Football
One plan built for Merrimack College Football, with the roster read, the coach's contact and a dated plan, delivered within 24 hours. An expert checks every plan.
- 109
- Roster
- 25
- Leaving
- 23%
- In-state
- 9%
- Transfers
Overview
Merrimack College Football Team Details
Key facts about the Merrimack College football team.
In North Andover, Massachusetts, Merrimack College competes as an independent in Division I FCS football. After the 2026-27 season, it loses six defensive backs, the most of any position group, followed by four defensive linemen. The roster is stable, with 82% of last season's non-seniors back, above the 67% median among FCS programs.
NCAA Division IIndependentMassachusetts
- Head coach
- Mike Gennetti
- Home venue
- Duane Stadium
- Average roster
- 109
- Five-year win rate
- 48%
Head Football Coach
players a season
Fit check
Do You Fit at Merrimack College?
Pick your position and level, add a test score if you have one, and get an instant read on your chances here. Free, and no account needed.
Coaching staff
Get on This Staff's Radar
Head coach
Mike GennettiHead Football CoachEmail●●●●●●@●●●●.edu
Phone(●●●) ●●●-●●●●
Roster
Roster Breakdown
The roster by class
21FreshmenFr.
37SophomoresSo.
26JuniorsJr.
22SeniorsSr.
3GraduateGrad
109 players on the latest roster (2026).
Roster openings after 2026-27
25players in their final year, 23% of the roster
Running Back 3 · Wide Receiver 3 · Tight End 2 · Offensive Line 3 · Defensive Line 4 · Linebacker 2 · Defensive Back 6 · Specialist 2
Watch defensive backs for the Class of 2027, since six leave after the 2026-27 season, followed by four defensive linemen. Players at those positions have the clearest chance to step into new roles.
See who you would be replacingAmong players who were not in their final year last season, 82% are back, a sign of a stable program.
Positions
Football Roster by Position
How many players a season the program carries at each position, and how tall they are.
Quarterback
5.3players a season
Average height 6'2"
Running Back
6.7players a season
Average height 5'11"
Wide Receiver
13.7players a season
Average height 6'0"
Tight End
6.3players a season
Average height 6'3"
Offensive Line
20.3players a season
Average height 6'3"
Defensive Line
17.3players a season
Average height 6'1"
Linebacker
12.3players a season
Average height 6'1"
Defensive Back
19.3players a season
Average height 6'0"
Specialist
6.7players a season
Average height 5'11"
Transfers
Transfers In and Out
10
transfers in for 2026-27
9
transfers out
- Share of the roster
- 9%
- Per 100 freshmen
- 48
- By position
- Quarterback 1 · Wide Receiver 2 · Offensive Line 1 · Defensive Line 1 · Defensive Back 3 · Specialist 2
- Came from
- 6 from Division I, 2 from Division II, 1 from Division III, 1 from NAIA
Footprint
Where This Team Recruits
Where the players are from
324players
In-state23.1%
Other US states75%
International1.9%
Counted from players on recent rosters with a known hometown.
Top home states
Maryland27%
Massachusetts23%
New Jersey14%
District of Columbia6%
Pennsylvania4%
A Maryland pipeline runs through this roster, with 27% of players from there compared with 23% from Massachusetts. Freshmen come from farther away than the roster as a whole, with 5% from Massachusetts versus 21% of the current roster.
Results
Merrimack College Football Recent Results
Swipe to see every season
2021
45%5-6overall
2-5conference
Best season
2022
73%8-3overall
6-1conference
2023
45%5-6overall
4-3conference
2024
45%5-6overall
Latest
2025
33%4-8overall
At 4-8, 2025 marked its lowest win rate in five seasons, below every other year of the stretch. Three consecutive seasons below .500, 2023 through 2025, put the win rate for that run at 41%.
Schedule and travel
Football Schedule
The season's games, home and away, and how far the team travels.
Recruiting
Recruiting Outlook
Merrimack competes at the NCAA Division I FCS level as an independent program and regularly faces FBS and strong FCS competition. The roster includes a mix of high school recruits, prep-school athletes, and transfers, so earning a spot typically requires verified game production, position-specific athleticism, and the ability to contribute on special teams.
Division I FCS competitionIndependent schedule with FBS and strong FCS opponentsRoster built through recruits, prep athletes, and transfers
Recruiting difficulty
60/ 100Hard
OpenCompetitiveSelectiveElite
Merrimack is a competitive Division I FCS program where most roster spots require a clear recruiting profile, but it is not currently positioned as an elite national contender.
What coaches value
- Position-specific technique and measurable athletic ability
- Physicality, toughness, and reliable tackling or blocking
- Football IQ, assignment discipline, and adaptability
- Special teams value, work ethic, academic readiness, and character
How to get recruited here
Build a complete recruiting profile with verified height, weight, testing numbers, transcript information, and quality game film. Contact the football staff early, identify your position fit, and attend camps or showcases where you can demonstrate technique, competitiveness, and special teams ability.
How hard is it to make the team
Making Merrimack's football team is challenging because it competes in Division I FCS and faces a demanding schedule. Recruited athletes with strong film, position-specific skills, and the physical profile for college football are most likely to earn opportunities, while walk-on chances may depend on roster needs and camp performance.
Who fits this program
- Football players seeking competitive NCAA Division I FCS opportunities.
- Athletes prepared to balance structured football demands with coursework.
- A small suburban campus near Boston suits this lifestyle.
- Position-specific athleticism and special-teams readiness support roster opportunities.
Videos
Merrimack College Football Videos
Program stats
The Program by the Numbers
111
Athletes on the roster
10
Coaches on staff
$4,947
Spent per athlete
Spending and revenue a year
Spending$5,305,897
Revenue$5,305,897
Revenue covers everything the program spends.
According to the 2025 EADA report, the program spends around $5,000 per athlete on operations, about 35% below the FCS median.
Source: the federal Equity in Athletics report, 2025.
Feeders
Top Feeder Schools and Clubs
The high schools and clubs that sent the most players to this roster.
1Gonzaga College High School5 players on recent rosters2Mount Saint Joseph High School5 players on recent rosters3Our Lady Of Good Counsel High School5 players on recent rosters4Calvert Hall3 players on recent rosters5Central Catholic3 players on recent rosters
The team has three sources tied at five players each across recent rosters, including Gonzaga College High School, and counts five sources that have each sent two or more players.
The school
School Environment
Merrimack College combines established academics with practical preparation in business, engineering, education and health fields, giving recruits a useful starting point for weighing coursework, faculty access and career outcomes.
 Merrimack CollegeNorth Andover, MassachusettsSee the full profile
70%
Acceptance rate
70%
Graduation rate
- Undergraduates
- 4,102
- Net price a year
- $37,927
- Earnings after ten years
- $75,584
Official links
Official Merrimack College Football Links
Similar programs
Similar Football Teams
Programs at a similar level, with similar academics, worth adding to your recruiting list.


Competitive athletics, rigorous academics and a close residential community appeal to recruits seeking commitment beyond their sport.
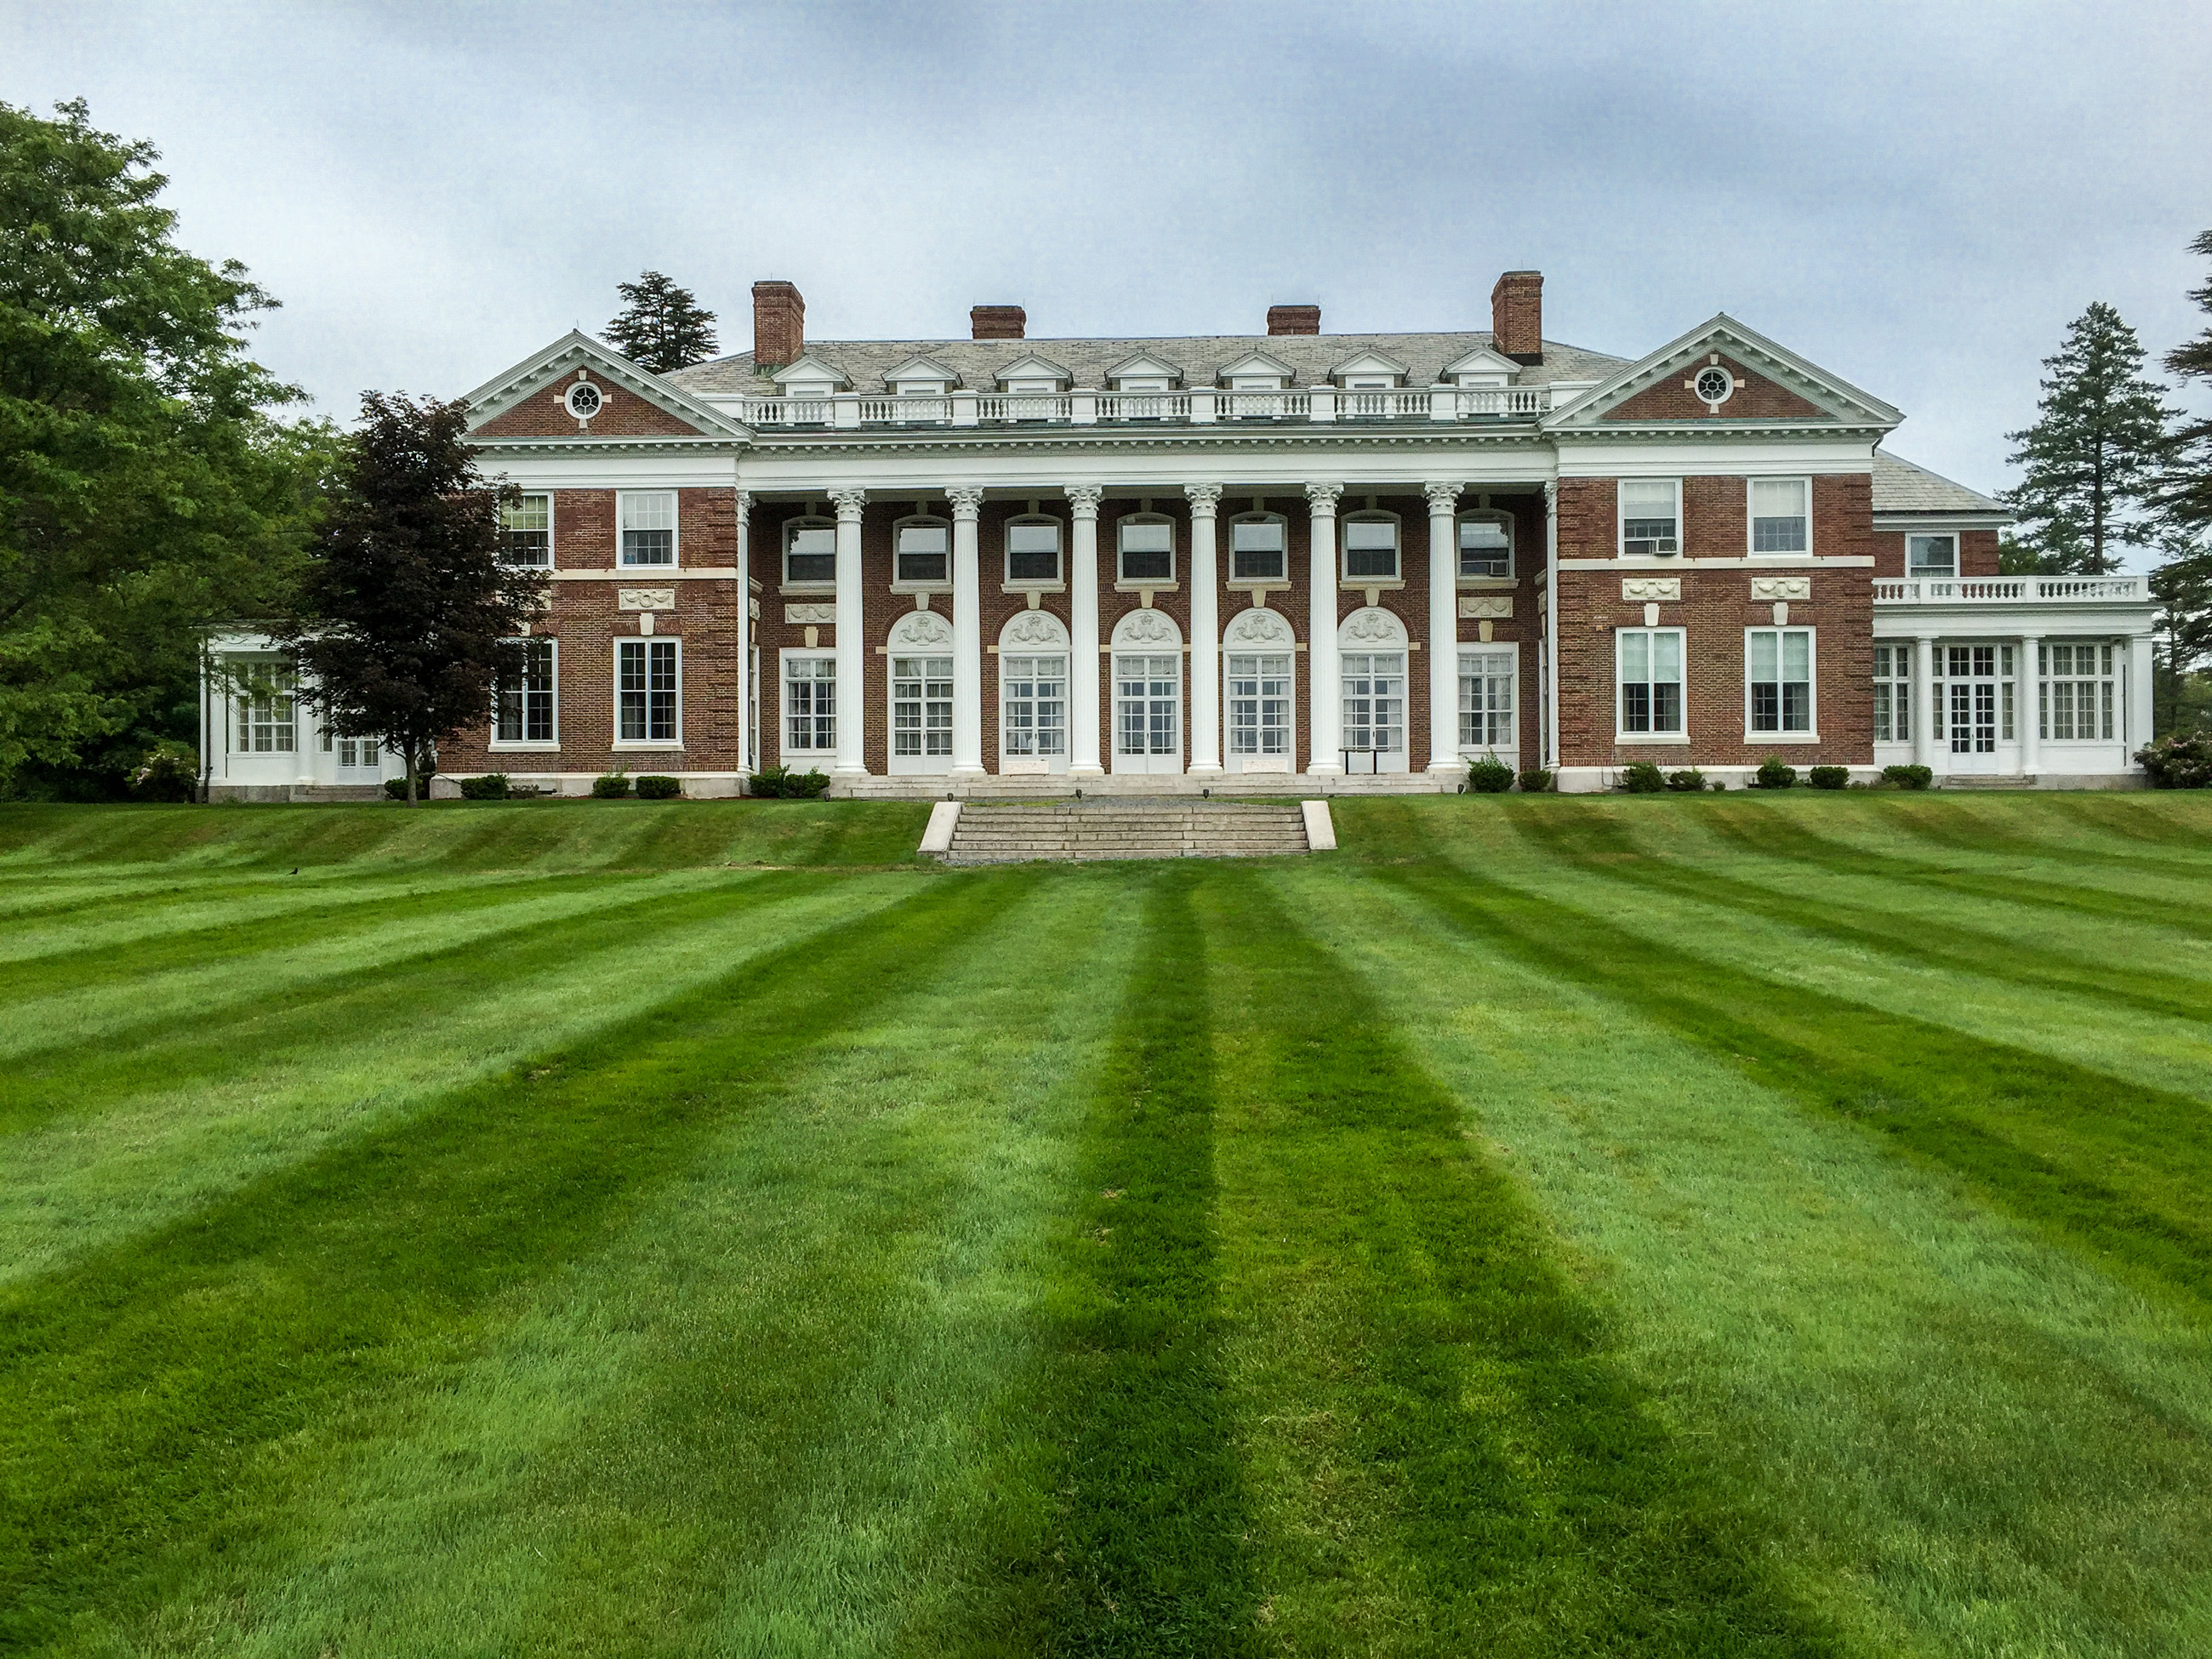

A small residential community, approachable faculty and competitive athletics help you connect your sport with broader goals.


Competitive athletics, research opportunities and an active residential community give recruits reasons to look closely here.


Athletes choose the combination of demanding competition, military leadership development and a close-knit cadet community.


A supportive HBCU community and career-focused academics give athletes reasons to look beyond the competition.
Teams in Massachusetts
More Football Teams in Massachusetts


Boston College
Chestnut Hill, MA
Competitive athletics, demanding academics and Boston access appeal to recruits who want substantial opportunities beyond their sport.
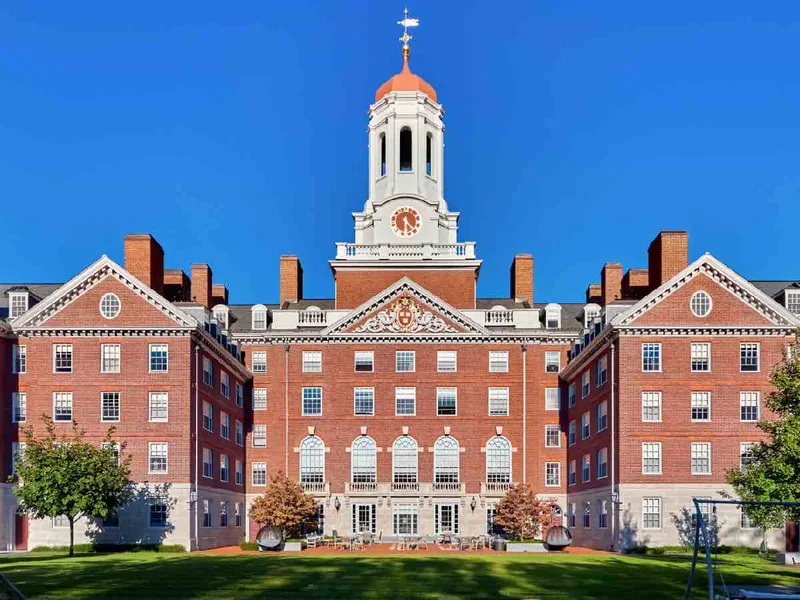

Harvard University
Cambridge, MA
Demanding academics, Ivy League competition and need-based financial support draw athletes ready for a rigorous college experience.


College of the Holy Cross
Worcester, MA
Athletes choose a close residential community where demanding liberal arts study complements competitive Division I athletics.
University of Massachusetts Amherst
Amherst, MA
Competitive athletics, research opportunities and an active residential community give recruits reasons to look closely here.
Stonehill College
Easton, MA
A small residential community, approachable faculty and competitive athletics help you connect your sport with broader goals.
Roster openings · 2026-27
Which D1 Football programs have the most roster spots opening up?
Every program ranked by players in their final year, with the positions they are losing.
29.7players leaving per program, on average
See the programs Three ways to start
Where are you in the search?
Pick the option that matches where you are, and we will show you the plan that fits.
Recruiting Plan
Your 20 to 25 best-fit schools, picked for you.



- Starter: the list, fit reads, real costs and a dated timeline
- Complete: adds roster reads and coach emails for every school
$99 or $249Starter or Complete, one time
Build my plan
Roster Report
The roster at your position, at the schools you pick.


- Who is graduating at your position, class year by class year
- Where spots are likely to open, in plain words
From $193, 8 or 15 schools
Choose my schools
School Plan
One school, covered end to end.
- Your honest odds, the roster and the verified coach
- Intro email, three follow-ups, admissions steps and timeline
$49One school, one time
Pick my school Resources