

Athletes come for Division I competition, a supportive HBCU community and academic options connected to practical careers.

NCAA Division IMid-Eastern Athletic ConferenceVirginia

Norfolk State University Football
One plan built for Norfolk State University Football, with the roster read, the coach's contact and a dated plan, delivered within 24 hours. An expert checks every plan.
- 105
- Roster
- 25
- Leaving
- 55%
- In-state
- 13%
- Transfers
Overview
Norfolk State University Football Team Details
Key facts about the Norfolk State University football team.
The Mid-Eastern Athletic Conference is the home league for Norfolk State University football, a Division I FCS program in Norfolk, Virginia. The most room for the Class of 2027 is among offensive linemen, with seven leaving after the 2026-27 season, followed by six defensive backs. It is a young group, with 40 of 105 players in their first year.
NCAA Division IMid-Eastern Athletic ConferenceVirginia
- Head coach
- Michael Vick
- Home venue
- William "Dick" Price Stadium
- Average roster
- 108
- Five-year win rate
- 28%
Head Football Coach
players a season
Fit check
Do You Fit at Norfolk State University?
Pick your position and level, add a test score if you have one, and get an instant read on your chances here. Free, and no account needed.
Coaching staff
Get on This Staff's Radar
Head coach
Michael VickHead Football CoachEmail●●●●●●@●●●●.edu
Phone(●●●) ●●●-●●●●
Roster
Roster Breakdown
The roster by class
40FreshmenFr.
18SophomoresSo.
22JuniorsJr.
22SeniorsSr.
3GraduateGrad
105 players on the latest roster (2026).
Roster openings after 2026-27
25players in their final year, 24% of the roster
Running Back 2 · Wide Receiver 3 · Tight End 1 · Offensive Line 7 · Defensive Line 2 · Linebacker 3 · Defensive Back 6 · Specialist 1
Looking at the Class of 2027, departures cluster among offensive linemen, with seven finishing up after the 2026-27 season, followed by six defensive backs. Recruits at those positions would face the least entrenched competition.
See who you would be replacingJust 51% of last year's freshmen, sophomores and juniors are back on the roster, below the 67% median among FCS programs. First-year players fill 38% of the roster, 40 of 105, which makes this a youthful team.
Positions
Football Roster by Position
How many players a season the program carries at each position, and how tall they are.
Quarterback
4.3players a season
Average height 6'3"
Running Back
7.3players a season
Average height 5'10"
Wide Receiver
16players a season
Average height 6'0"
Tight End
4.7players a season
Average height 6'3"
Offensive Line
20.7players a season
Average height 6'3"
Defensive Line
14.3players a season
Average height 6'3"
Linebacker
13.3players a season
Average height 6'1"
Defensive Back
21players a season
Average height 6'0"
Specialist
4.7players a season
Average height 6'1"
Transfers
Transfers In and Out
14
transfers in for 2026-27
12
transfers out
- Share of the roster
- 13%
- Per 100 freshmen
- 35
- By position
- Running Back 1 · Wide Receiver 1 · Tight End 1 · Offensive Line 4 · Defensive Line 3 · Defensive Back 4
- Came from
- 10 from Division I, 3 from Division II, 1 from Division III
Footprint
Where This Team Recruits
Where the players are from
317players
In-state54.9%
Other US states44.2%
International0.9%
Counted from players on recent rosters with a known hometown.
Top home states
Virginia55%
Georgia9%
North Carolina8%
Florida6%
Maryland3%
Recruiting here starts at home, since 55% of players are from Virginia, compared with a median of 33% among FCS programs.
Results
Norfolk State University Football Recent Results
Swipe to see every season
Best season
2021
55%6-5overall
2-3conference
2022
18%2-9overall
2-3conference
2023
27%3-8overall
1-4conference
2024
33%4-8overall
2-3conference
Latest
2025
8%1-11overall
0-5conference
After going 4-8 in 2024, this team finished 1-11 in 2025, a step back of 25 points in winning percentage. A 28% winning percentage across five seasons sits in the bottom quarter among FCS programs.
Standings
Mid-Eastern Athletic Conference Standings
Where Norfolk State University stands in the Mid-Eastern Athletic Conference.
Schedule and travel
Football Schedule
The season's games, home and away, and how far the team travels.
Recruiting
Recruiting Outlook
Norfolk State competes in NCAA Division I FCS football in the MEAC. The program is in a rebuilding phase after a difficult 2025 season, but its schedule, transfer activity, and Division I level still make roster opportunities competitive and primarily recruiting driven.
NCAA Division I FCS and MEAC competitionRebuilding program with recent roster turnoverSchedule includes FBS and competitive FCS opponents
Recruiting difficulty
60/ 100Moderate
OpenCompetitiveSelectiveElite
Making the team is challenging because most Division I roster spots require strong film, physical development, and position-specific production, although the program's current rebuilding stage may create more pathways than an established national contender.
What coaches value
- Position-specific technique, football IQ, and consistent execution
- Verified athleticism, speed, size, and strength for the player's position
- Physical competitiveness and reliability in contact situations
- Special teams value, coachability, academic readiness, and team-first habits
How to get recruited here
Build a concise highlight film supported by full-game footage, verified measurements, testing results, academic information, and a position-specific evaluation. Contact the football recruiting staff early, explain why Norfolk State fits your goals, and keep updating the program with meaningful competition results, training progress, and academic improvements.
How hard is it to make the team
Norfolk State is a competitive Division I FCS program, so making the roster is difficult even though the team is rebuilding. Recruited high school players, transfers, and athletes who can contribute on special teams or at multiple positions may have the clearest paths, but coaches will still expect Division I athletic ability and dependable film.
Who fits this program
- Football players should expect competitive Division I opportunities shaped by recruiting.
- Students should plan carefully for academics alongside Division I football demands.
- An urban, medium-sized public university suits city-oriented campus lifestyles.
- Athletes comfortable adapting to roster turnover may fit this setting.
Videos
Norfolk State University Football Videos
Program stats
The Program by the Numbers
143
Athletes on the roster
11
Coaches on staff
$4,558
Spent per athlete
Spending and revenue a year
Spending$7,071,944
Revenue$7,071,944
Revenue covers everything the program spends.
Coaching time is shared widely, at around 13 athletes per coach in the 2025 EADA report, above the median of 10 among FCS programs.
Source: the federal Equity in Athletics report, 2025.
The school
School Environment
Norfolk State University combines strengths in science, engineering and business with research and experiential learning, giving athletes career-focused options to weigh alongside classroom expectations, faculty access and degree completion.
 Norfolk State UniversityNorfolk, VirginiaSee the full profile
88%
Acceptance rate
39%
Graduation rate
- Undergraduates
- 5,410
- Net price a year
- $15,282
- Earnings after ten years
- $44,666
Official links
Official Norfolk State University Football Links
Similar programs
Similar Football Teams
Programs at a similar level, with similar academics, worth adding to your recruiting list.
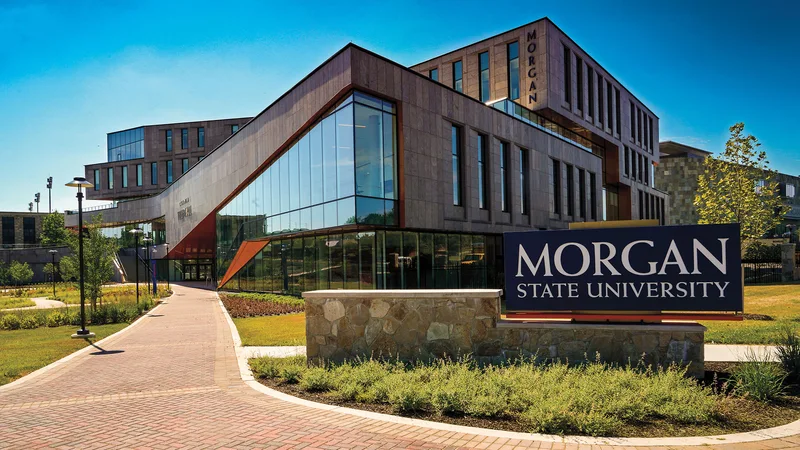

Athletes come for competitive conference play, career-focused academics and a culturally engaged community in Baltimore.


Athletes find competitive conference play, a supportive campus and practical academic options within a historically Black university.


Division I competition, a close campus community and professional academic options give recruits distinct reasons to consider Hampton.


Accessible admissions, a close-knit HBCU community and Division I competition give athletes distinct reasons to consider this campus.


Competitive athletics, career-focused academics and relatively affordable costs give recruits practical reasons to consider this campus.
Teams in Virginia
More Football Teams in Virginia


Georgetown University
Washington, DC
Competitive athletics, Washington internships and a Jesuit educational tradition attract athletes with strong academic ambitions.


James Madison University
Harrisonburg, VA
Competitive athletics, hands-on academics and an engaged campus community give recruits several reasons to consider studying here.


Liberty University
Lynchburg, VA
Christian campus culture, career-focused programs and Division I competition attract athletes seeking alignment between faith and college goals.


Old Dominion University
Norfolk, VA
Research opportunities, professional programs and urban campus life complement the demands of competing at the Division I level.


University of Virginia
Charlottesville, VA
ACC competition, rigorous academics and a residential campus attract athletes looking for a demanding college experience.


Virginia Polytechnic Institute and State University
Blacksburg, VA
ACC competition, strong technical academics and a spirited residential community give athletes compelling reasons to consider Blacksburg.


Virginia Military Institute
Lexington, VA
Athletes choose the combination of demanding competition, military leadership development and a close-knit cadet community.


The College of William & Mary
Williamsburg, VA
Athletes choose this historic university for demanding academics, Division I competition and a close campus community.
Hampton University
Hampton, VA
Division I competition, a close campus community and professional academic options give recruits distinct reasons to consider Hampton.


University of Richmond
Richmond, VA
Close faculty mentoring, competitive athletics and a residential community appeal to athletes who want demanding academics.
Roster openings · 2026-27
Which D1 Football programs have the most roster spots opening up?
Every program ranked by players in their final year, with the positions they are losing.
29.7players leaving per program, on average
See the programs Three ways to start
Where are you in the search?
Pick the option that matches where you are, and we will show you the plan that fits.
Recruiting Plan
Your 20 to 25 best-fit schools, picked for you.



- Starter: the list, fit reads, real costs and a dated timeline
- Complete: adds roster reads and coach emails for every school
$99 or $249Starter or Complete, one time
Build my plan
Roster Report
The roster at your position, at the schools you pick.


- Who is graduating at your position, class year by class year
- Where spots are likely to open, in plain words
From $193, 8 or 15 schools
Choose my schools
School Plan
One school, covered end to end.
- Your honest odds, the roster and the verified coach
- Intro email, three follow-ups, admissions steps and timeline
$49One school, one time
Pick my school Resources