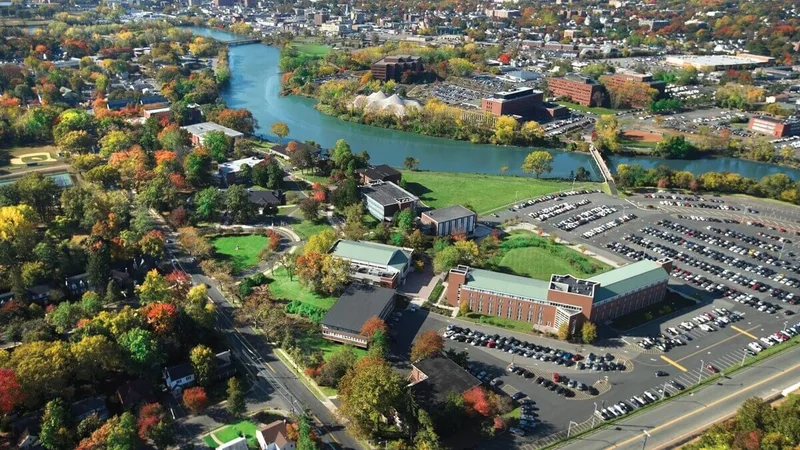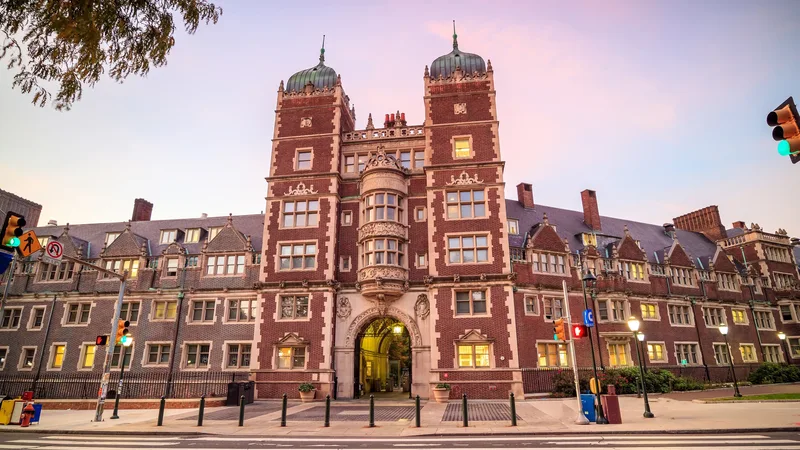

University of Pennsylvania
Philadelphia · PA · The Ivy League
7of 20 players in their final year35% of the roster
- 23
- Average roster
- 66%
- 5-year win rate
- 0%
- In-state
Browse programs
College directoryEvery program, filtered by what fits Sport directoryMen's and women's, every division State directoryPrograms in the states you would play inGo deeper
Major directoryYour major and your sport in one list Camp directoryID camps and showcases at college programs Conference directoryEvery conference and its member collegesWhich D1 Women's Fencing programs lose the most players after the 2026-27 season, and at which positions. Built from current college rosters and updated every season.
The big picture
Programs lose about as many players each year as they bring in, and the class of 2027 will fill the spots left by this year's final-year players.
Most openings
Ranked by players in their final year on the current roster.
Philadelphia · PA · The Ivy League

Evanston · IL · Midwest Conference

Cambridge · MA · The Ivy League

Princeton · NJ · The Ivy League

Providence · RI · The Ivy League

Newark · NJ · Independent

Detroit · MI · Independent

Philadelphia · PA · Independent

New Haven · CT · The Ivy League

Staten Island · NY · Independent

Teaneck · NJ · Independent
How to read it
Here is how to read these numbers and use them to decide which programs to contact first.
More players leaving usually means more room in the next recruiting class, especially at your position.
Coaches also fill spots with transfers, and some players use an extra year, so treat these as openings to explore, not guaranteed spots.
Use it to decide which programs to contact first, starting with the ones losing players at your position.
Based on 2026-27 college rosters. Counts seniors and graduate students. Updated every season.
Keep exploring
Three ways to start
Pick the option that matches where you are, and we will show you the plan that fits.