
NCAA Division IAtlantic Coast ConferenceVirginia

Virginia Polytechnic Institute and State University Baseball
One plan built for Virginia Polytechnic Institute and State University Baseball, with the roster read, the coach's contact and a dated plan, delivered within 24 hours. An expert checks every plan.
- 35
- Roster
- 11
- Leaving
- 36%
- In-state
- 0%
- Transfers
Overview
Virginia Polytechnic Institute and State University Baseball Team Details
Key facts about the Virginia Polytechnic Institute and State University baseball team.
In Blacksburg, Virginia, the Virginia Polytechnic Institute and State University baseball program represents two campuses and competes in the Atlantic Coast Conference at the Division I level. The most room for the Class of 2027 is among pitchers, with five leaving after the 2026-27 season, followed by four infielders. It has finished above .500 in each of the last five seasons.
NCAA Division IAtlantic Coast ConferenceVirginia
- Head coach
- John Szefc
- Home venue
- English Field
- Average roster
- 40
- Five-year win rate
- 60%
Head Coach
players a season
Fit check
Do You Fit at Virginia Polytechnic Institute and State University?
Pick your position and level, add a test score if you have one, and get an instant read on your chances here. Free, and no account needed.
Coaching staff
Get on This Staff's Radar
Head coach
John SzefcHead CoachEmail●●●●●●@●●●●.edu
Phone(●●●) ●●●-●●●●
Roster
Roster Breakdown
The roster by class
13FreshmenFr.
7SophomoresSo.
10JuniorsJr.
9SeniorsSr.
2GraduateGrad
41 players on the latest roster (2027).
Roster openings after 2026-27
11players in their final year, 31% of the roster
Pitcher 5 · Catcher 1 · Infielder 4 · Outfielder 1
After the 2026-27 season, five pitchers will leave, the largest group of departures by position, followed by four infielders. Players at those positions have the clearest chance to step into new roles.
See who you would be replacingPositions
Baseball Roster by Position
How many players a season the program carries at each position, and how tall they are.
Pitcher
21.3players a season
Average height 6'2"
Catcher
3.7players a season
Average height 6'2"
Infielder
9.7players a season
Average height 6'0"
Outfielder
5players a season
Average height 6'0"
Utility/Designated Hitter
0.7players a season
Average height 6'1"
Roster spots lean away from outfielders, which fill 12% of the roster against 17% on the average Division I baseball team. The infielders group fills 24% of the roster, about 10 a season, above the 14% average among Division I baseball teams.
Transfers
Transfers In and Out
0
transfers in for 2026-27
4
transfers out
- Share of the roster
- 0%
- Per 100 freshmen
- 0
Footprint
Where This Team Recruits
Where the players are from
121players
In-state35.5%
Other US states63.6%
International0.8%
Counted from players on recent rosters with a known hometown.
Top home states
Virginia36%
Pennsylvania13%
Tennessee8%
North Carolina7%
Florida5%
Results
Virginia Polytechnic Institute and State University Baseball Recent Results
Swipe to see every season
2021
52%27-25overall
16-20conference
Best season
2022
76%45-14overall
19-9conference
2023
57%30-23overall
12-17conference
2024
59%32-22overall
14-16conference
Latest
2025
55%31-25overall
12-18conference
Winning has been steady here, with five consecutive winning seasons and a 60% win rate since 2021. At the same time, a 12-18 record in Atlantic Coast Conference play in 2025 trailed a 31-25 record overall.
Recruiting
Recruiting Outlook
Virginia Tech baseball is a highly competitive NCAA Division I program in the ACC. The Hokies returned to the NCAA Tournament in 2026, their 12th appearance, and have recently established themselves as a postseason-level program. Recruits should expect strong competition from experienced college players, transfers, and high-level freshmen.
ACC Power Four competition2026 NCAA Tournament berthRecent Super Regional appearance
Recruiting difficulty
80/ 100Hard
OpenCompetitiveSelectiveElite
The program competes in the ACC and recently returned to the NCAA Tournament, so most roster opportunities are likely to favor recruited players with advanced tools and consistent performance.
What coaches value
- Pitchers with command, velocity, pitch development, and the ability to execute under pressure
- Position players who combine measurable offensive tools with reliable defense and baserunning
- Catchers and infielders who communicate well, handle game strategy, and make sound decisions
- Players who respond to data-driven development, strength training, and demanding ACC-level competition
How to get recruited here
Build a complete recruiting profile with verified video, academic information, measurable testing data, and recent competition results. Contact the baseball staff early, explain your position-specific strengths, and show that your tools and performance translate against strong high school, club, or junior college competition.
How hard is it to make the team
Making Virginia Tech's baseball team is difficult because it is an ACC program with recent NCAA Tournament experience. Most roster spots are likely to go to recruited players who can contribute at the Division I level, although development and transfer pathways can also matter.
Who fits this program
- Baseball players seeking highly competitive NCAA Division I competition
- Athletes prepared to balance Division I baseball with university coursework
- Students seeking a large residential campus in a rural setting
- Athletes comfortable with structured schedules and daily role competition
Program stats
The Program by the Numbers
45
Athletes on the roster
4
Coaches on staff
$29,933
Spent per athlete
Spending and revenue a year
Spending$3,966,801
Revenue$1,313,850
Revenue covers 33% of what the program spends.
The program puts roughly $29,000 per athlete into operations in the 2025 EADA report, about three times the Division I median. By the same report, the program reports around $4.0 million in expenses against $1.3 million in revenue, so revenue covers 33% of spending.
Source: the federal Equity in Athletics report, 2025.
Feeders
Top Feeder Schools and Clubs
The high schools and clubs that sent the most players to this roster.
1Don Bosco Preparatory High School4 players on recent rosters
2Benedictine Prep2 players on recent rosters
Don Bosco Preparatory High School supplies four players, more than any other source, with Benedictine Prep next at two.
The school
School Environment
Virginia Polytechnic Institute and State University combines engineering and research strengths with challenging coursework, making academic fit, faculty access and progress toward graduation important considerations alongside your athletic goals.
Virginia Polytechnic Institute and State UniversityBlacksburg, VirginiaSee the full profile 55%
Acceptance rate
86%
Graduation rate
- Undergraduates
- 31,035
- Net price a year
- $24,953
- Earnings after ten years
- $81,698
Camps
Virginia Polytechnic Institute and State University Baseball Camps
New camp dates are not posted yet. These ran last season.
Official links
Official Virginia Polytechnic Institute and State University Baseball Links
Similar programs
Similar Baseball Teams
Programs at a similar level, with similar academics, worth adding to your recruiting list.


Strong academics, prominent athletics and in-state affordability give recruits compelling reasons to consider this spirited campus.


ACC competition, applied academics and Raleigh career connections give athletes clear reasons to consider studying here.


SEC competition, strong professional programs and a spirited residential campus draw athletes who want an involved college experience.


SEC competition, strong academics and Austin's active city life attract athletes seeking a demanding college experience.


Competitive athletics, established academic programs and a faith-centered community appeal to athletes seeking structure and value.


Big Ten competition, strong technical academics and a residential college-town experience give athletes distinct reasons to consider Purdue.
Teams in Virginia
More Baseball Teams in Virginia


George Mason University
Fairfax, VA
Competitive athletics, career-focused academics and access to Washington help athletes connect college goals with life after graduation.


Georgetown University
Washington, DC
Competitive athletics, Washington internships and a Jesuit educational tradition attract athletes with strong academic ambitions.


James Madison University
Harrisonburg, VA
Competitive athletics, hands-on academics and an engaged campus community give recruits several reasons to consider studying here.


Liberty University
Lynchburg, VA
Christian campus culture, career-focused programs and Division I competition attract athletes seeking alignment between faith and college goals.


Longwood University
Farmville, VA
A small residential community and accessible faculty help athletes keep academics connected to their competitive goals.


Old Dominion University
Norfolk, VA
Research opportunities, professional programs and urban campus life complement the demands of competing at the Division I level.
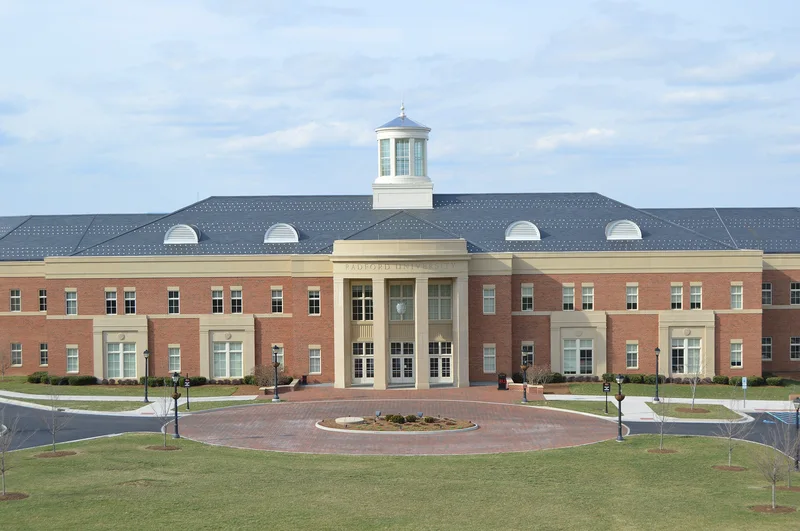

Radford University
Radford, VA
Career-focused learning, reachable faculty and Big South competition give athletes practical reasons to consider this campus.


Virginia Commonwealth University
Richmond, VA
Competitive athletics, distinctive academic strengths and Richmond career opportunities give recruits several reasons to consider studying here.


University of Virginia
Charlottesville, VA
ACC competition, rigorous academics and a residential campus attract athletes looking for a demanding college experience.


Virginia Military Institute
Lexington, VA
Athletes choose the combination of demanding competition, military leadership development and a close-knit cadet community.


The College of William & Mary
Williamsburg, VA
Athletes choose this historic university for demanding academics, Division I competition and a close campus community.


Norfolk State University
Norfolk, VA
A supportive HBCU community and career-focused academics give athletes reasons to look beyond the competition.
Roster openings · 2026-27
Which D1 Baseball programs have the most roster spots opening up?
Every program ranked by players in their final year, with the positions they are losing.
10.2players leaving per program, on average
See the programs Three ways to start
Where are you in the search?
Pick the option that matches where you are, and we will show you the plan that fits.
Recruiting Plan
Your 20 to 25 best-fit schools, picked for you.



- Starter: the list, fit reads, real costs and a dated timeline
- Complete: adds roster reads and coach emails for every school
$99 or $249Starter or Complete, one time
Build my plan
Roster Report
The roster at your position, at the schools you pick.


- Who is graduating at your position, class year by class year
- Where spots are likely to open, in plain words
From $193, 8 or 15 schools
Choose my schools
School Plan
One school, covered end to end.
- Your honest odds, the roster and the verified coach
- Intro email, three follow-ups, admissions steps and timeline
$49One school, one time
Pick my school Resources