

Athletes come for competitive conference play, personal faculty attention and academic connections to Los Angeles industries.

NCAA Division IWest Coast ConferenceCalifornia

University of the Pacific Women's Cross Country
One plan built for University of the Pacific Women's Cross Country, with the roster read, the coach's contact and a dated plan, delivered within 24 hours. An expert checks every plan.
- 16
- Roster
- 4
- Leaving
- 68%
- In-state
- 6%
- Transfers
Overview
University of the Pacific Women's Cross Country Team Details
Key facts about the University of the Pacific women's cross country team.
University of the Pacific plays Division I women's cross country in the West Coast Conference. Only 60% of last season's non-seniors returned, which marks high turnover among Division I women's cross country teams. Its athletes come from a tight circle of states, with the top five supplying 93% of the roster.
NCAA Division IWest Coast ConferenceWestCalifornia
- Head coach
- Cherise Roberts
- Average roster
- 14
Director of Track & Field and Cross Country
players a season
Fit check
Do You Fit at University of the Pacific?
Pick your position and level, add a test score if you have one, and get an instant read on your chances here. Free, and no account needed.
Coaching staff
Get on This Staff's Radar
Head coach
Cherise RobertsDirector of Track & Field and Cross CountryEmail●●●●●●@●●●●.edu
Phone(●●●) ●●●-●●●●
Roster
Roster Breakdown
The roster by class
5FreshmenFr.
5SophomoresSo.
2JuniorsJr.
4SeniorsSr.
16 players on the latest roster (2026).
Roster openings after 2026-27
4players in their final year, 25% of the roster
See who you would be replacing Turnover is high, with only 60% of last season's freshmen, sophomores and juniors listed this year, compared with a median of 83% among Division I women's cross country teams.
Transfers
Transfers In and Out
1
transfers in for 2026-27
1
transfers out
- Share of the roster
- 6%
- Per 100 freshmen
- 20
- Came from
- 1 from Division II
Footprint
Where This Team Recruits
Where the players are from
41players
In-state68.3%
Other US states29.3%
International2.4%
Counted from players on recent rosters with a known hometown.
Top home states
California68%
Utah10%
Washington7%
Texas5%
Hawaii2%
Athletes come from a tight geographic circle, with 93% of the roster from the top five states, against a median of 77% among Division I women's cross country teams.
Schedule and travel
Women's Cross Country Schedule
The season's games, home and away, and how far the team travels.
Feeders
Top Feeder Schools and Clubs
The high schools and clubs that sent the most players to this roster.
1St Mary's High School3 players on recent rosters
One pipeline stands out: St Mary's High School, with three athletes on recent rosters and no other source close. That pipeline matters for recruits in its region.
The school
School Environment
The University of the Pacific pairs professional schools in pharmacy, dentistry and law with business, engineering, music and the sciences, making academic fit about your career plans as well as coursework and faculty access.
University of the PacificStockton, CaliforniaSee the full profile 71%
Acceptance rate
73%
Graduation rate
- Undergraduates
- 3,249
- Net price a year
- $24,186
- Earnings after ten years
- $88,053
Official links
Official University of the Pacific Women's Cross Country Links
Similar programs
Similar Cross Country Teams
Programs at a similar level, with similar academics, worth adding to your recruiting list.


Coastal campus life, accessible faculty and competitive athletics appeal to recruits seeking a small, faith-based community.


A residential community, strong career outcomes and demanding conference competition appeal to athletes seeking academic and athletic commitment.


Research opportunities, Big East competition and a lively residential campus give athletes compelling reasons to consider studying here.
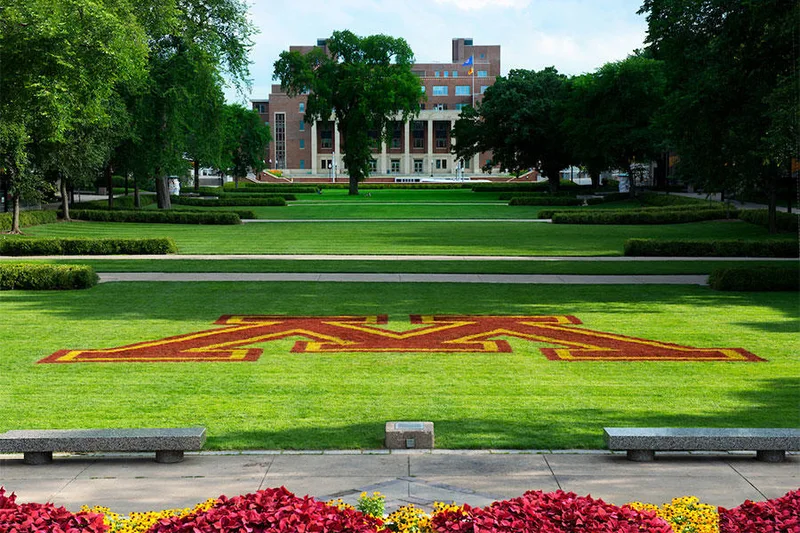

Big Ten competition, research strength and access to Twin Cities employers give athletes strong reasons to consider Minnesota.


Nationally prominent basketball, reachable faculty and strong career outcomes give athletes compelling reasons to consider this campus.
Roster openings · 2026-27
Which D1 Women's Cross Country programs have the most roster spots opening up?
Every program ranked by players in their final year, with the positions they are losing.
3.6players leaving per program, on average
See the programs Three ways to start
Where are you in the search?
Pick the option that matches where you are, and we will show you the plan that fits.
Recruiting Plan
Your 20 to 25 best-fit schools, picked for you.



- Starter: the list, fit reads, real costs and a dated timeline
- Complete: adds roster reads and coach emails for every school
$99 or $249Starter or Complete, one time
Build my plan
Roster Report
The roster at your position, at the schools you pick.


- Who is graduating at your position, class year by class year
- Where spots are likely to open, in plain words
From $193, 8 or 15 schools
Choose my schools
School Plan
One school, covered end to end.
- Your honest odds, the roster and the verified coach
- Intro email, three follow-ups, admissions steps and timeline
$49One school, one time
Pick my school Resources
Additional Resources
Pathley Cross Country hubRankings, divisions and programsCross Country recruiting timelineWhat to do each year of high schoolHow coaches evaluate college cross countryWhat coaches look for at this levelThe cross country recruiting guideContact rules, emails and costsEvery D1 Women's Cross Country programThe full list, with filters