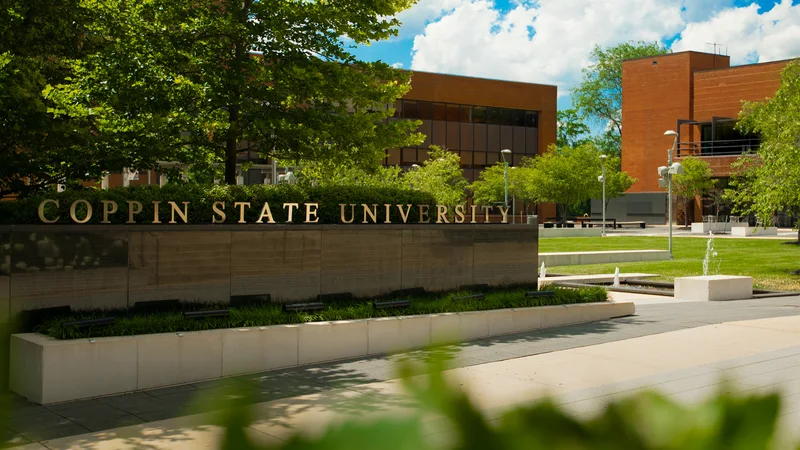

Athletes can combine Division I competition with a small HBCU community, career-focused academics and affordable public education.
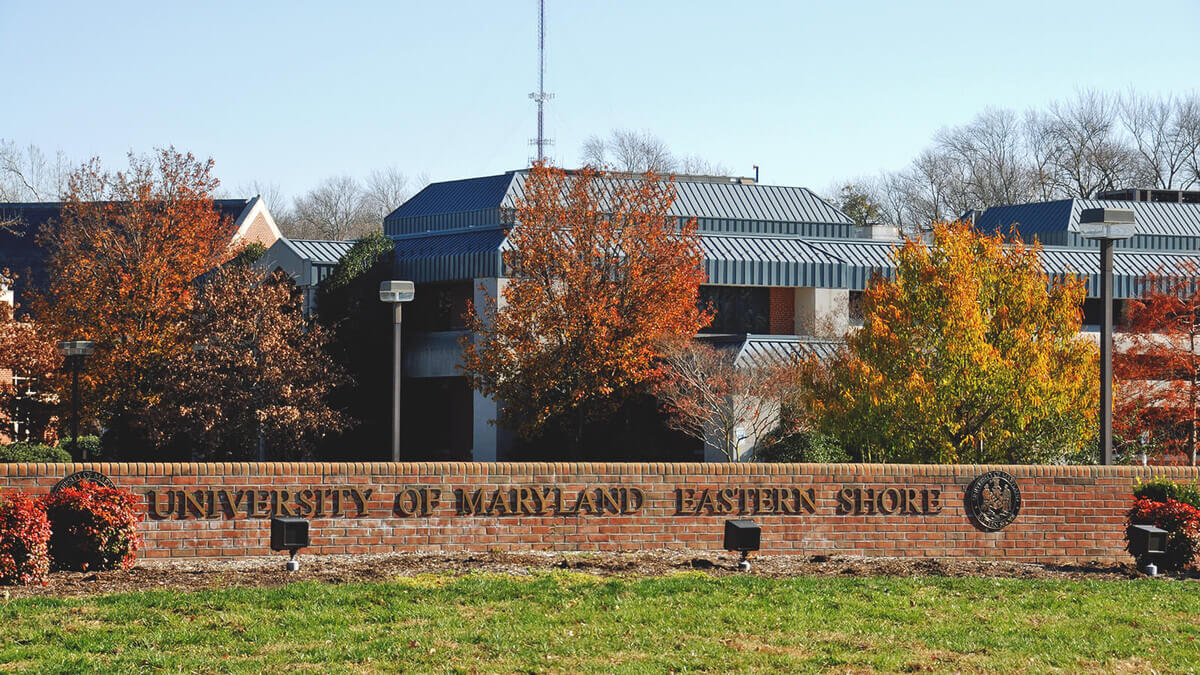
NCAA Division INortheast ConferenceMaryland

University of Maryland Eastern Shore Baseball
One plan built for University of Maryland Eastern Shore Baseball, with the roster read, the coach's contact and a dated plan, delivered within 24 hours. An expert checks every plan.
- 34
- Roster
- 28%
- In-state
Overview
University of Maryland Eastern Shore Baseball Team Details
Key facts about the University of Maryland Eastern Shore baseball team.
The Northeast Conference includes University of Maryland Eastern Shore, which competes in Division I baseball. By winning percentage over the last five seasons, at 20%, it sits in the bottom 10% among Division I baseball teams. Infielders make up 29% of the roster, above the 22% average among Division I baseball teams.
NCAA Division INortheast ConferenceMid-AtlanticMaryland
- Head coach
- Justin Thomas
- Home venue
- Hawk Stadium
- Average roster
- 34
- Five-year win rate
- 20%
Head Coach
players a season
Fit check
Do You Fit at University of Maryland Eastern Shore?
Pick your position and level, add a test score if you have one, and get an instant read on your chances here. Free, and no account needed.
Coaching staff
Get on This Staff's Radar
Head coach
Justin ThomasHead CoachEmail●●●●●●@●●●●.edu
Phone(●●●) ●●●-●●●●
Roster
Roster Breakdown
The roster by class
6FreshmenFr.
9SophomoresSo.
9JuniorsJr.
8SeniorsSr.
1GraduateGrad
33 players on the latest roster (2026).
Transfers in matter here, with 13 players on the current roster arriving from another college, two of them from Division I programs.
Positions
Baseball Roster by Position
How many players a season the program carries at each position, and how tall they are.
Pitcher
14players a season
Average height 6'1"
Catcher
3.3players a season
Average height 6'0"
Infielder
10players a season
Average height 6'0"
Outfielder
6.3players a season
Average height 6'0"
Utility/Designated Hitter
0.3players a season
Average height 5'11"
Infielders account for 29% of the roster, roughly 10 a year, versus 22% on the average Division I baseball team.
Footprint
Where This Team Recruits
Where the players are from
96players
In-state28.1%
Other US states70.8%
International1%
Counted from players on recent rosters with a known hometown.
Top home states
Maryland28%
New York10%
Puerto Rico10%
Pennsylvania9%
New Jersey7%
No single state dominates, with the five biggest supplying just 66% of players, compared with a median of 78% among Division I baseball teams. A national footprint like that means coaches look well beyond the home region.
Results
University of Maryland Eastern Shore Baseball Recent Results
Swipe to see every season
2022
31%17-37overall
15-18conference
Best season
2023
33%18-37overall
14-16conference
2024
0%0-48overall
0-30conference
2025
15%7-41overall
6-24conference
Latest
2026
19%9-39overall
8-25conference
Against a median of 49% among Division I baseball teams, this team has a 20% winning percentage over five seasons.
Standings
Northeast Conference Standings
Where University of Maryland Eastern Shore stands in the Northeast Conference.
Schedule and travel
Baseball Schedule
The season's games, home and away, and how far the team travels.
Recruiting
Recruiting Outlook
University of Maryland Eastern Shore men's baseball is an NCAA Division I program competing in the Northeast Conference. The Hawks reached the NEC Tournament in 2023, and the 2025 season brought a seven-win improvement from the previous year with six conference victories. Division I roster competition remains demanding, but the recent young profile can create opportunities for prepared recruits with measurable baseball tools, competitive toughness and dependable academics.
NCAA Division I Northeast Conference competition2023 NEC Tournament appearanceSeven-win improvement in 2025
Recruiting difficulty
60/ 100
OpenCompetitiveSelectiveElite
The Division I level and recent NEC Tournament appearance indicate meaningful competition, while recent improvement suggests prepared recruits can earn opportunities.
What coaches value
- Consistent bat speed, strike-zone control and quality at-bats against Division I pitching
- Position-specific defensive range, throwing accuracy and sound baserunning decisions
- Competitive toughness, repeatable mechanics and durability through a full schedule
- Academic consistency, coachability and willingness to contribute within a developing team
How to get recruited here
Send the staff your graduation year, primary and secondary positions, height, bats and throws, verified statistics, video, transcript or GPA, and your high school and travel schedule. Reach out before the main recruiting periods, update coaches after meaningful performances, and attend camps or showcase events where staff can evaluate exit velocity, pitching velocity, defensive actions, 60-yard time and game performance.
Who fits this program
- NCAA Division I baseball suits athletes with strong high school or club experience and clear position-specific tools.
- The public university offers an accessible academic environment alongside demanding Division I baseball commitments.
- A small undergraduate campus in rural Princess Anne suits athletes seeking a quieter residential setting.
- Athletes seeking HBCU community, development and meaningful Division I competition may fit best.
Videos
University of Maryland Eastern Shore Baseball Videos
The school
School Environment
The University of Maryland Eastern Shore pairs a land-grant HBCU mission with health professions, aviation, hospitality and golf management programs, making academic support, faculty access and degree completion important considerations alongside your sport.
University of Maryland Eastern ShorePrincess Anne, MarylandSee the full profile 96%
Acceptance rate
35%
Graduation rate
- Undergraduates
- 2,476
- Net price a year
- $17,378
- Earnings after ten years
- $52,085
Official links
Official University of Maryland Eastern Shore Baseball Links
Similar programs
Similar Baseball Teams
Programs at a similar level, with similar academics, worth adding to your recruiting list.


A supportive HBCU community and career-focused academics give athletes reasons to look beyond the competition.


Conference competition, practical academic programs and Huntsville career opportunities give athletes several reasons to consider Alabama A&M.
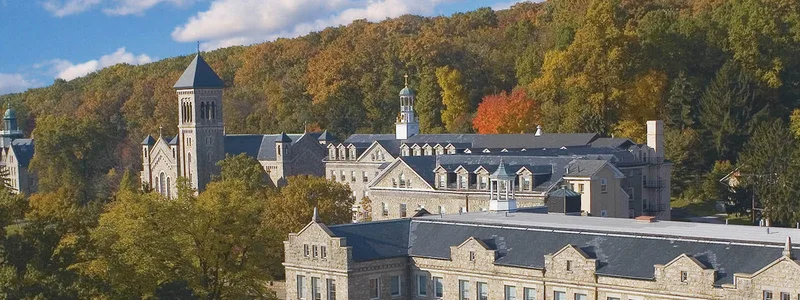

Close faculty relationships and career-focused learning complement competitive athletics within a small Catholic campus community.


Division I competition, close faculty access and career-focused programs give athletes a small university experience near New York City.
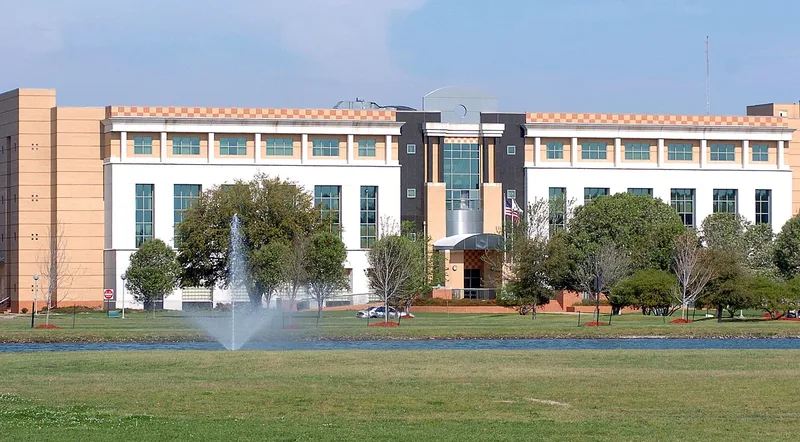

Accessible admissions, affordability and a small-campus community give recruits practical reasons to consider competing here.
Roster openings
Which D1 Baseball programs have the most roster spots opening up?
Every program ranked by players in their final year, with the positions they are losing.
10.2players leaving per program, on average
See the programs Three ways to start
Where are you in the search?
Pick the option that matches where you are, and we will show you the plan that fits.
Recruiting Plan
Your 20 to 25 best-fit schools, picked for you.



- Starter: the list, fit reads, real costs and a dated timeline
- Complete: adds roster reads and coach emails for every school
$99 or $249Starter or Complete, one time
Build my plan
Roster Report
The roster at your position, at the schools you pick.


- Who is graduating at your position, class year by class year
- Where spots are likely to open, in plain words
From $193, 8 or 15 schools
Choose my schools
School Plan
One school, covered end to end.
- Your honest odds, the roster and the verified coach
- Intro email, three follow-ups, admissions steps and timeline
$49One school, one time
Pick my school Resources