Big 12 competition, broad academic choices and active college-town life give athletes distinct reasons to consider Kansas.

NCAA Division IBig 12 ConferenceTexas

Texas Tech University Baseball
One plan built for Texas Tech University Baseball, with the roster read, the coach's contact and a dated plan, delivered within 24 hours. An expert checks every plan.
- 13
- Roster
- 3
- Leaving
- 60%
- In-state
- 0%
- Transfers
Overview
Texas Tech University Baseball Team Details
Key facts about the Texas Tech University baseball team.
From its campus in Lubbock, Texas, Texas Tech University competes in Division I baseball as a member of the Big 12 Conference. Its roster of 13 is one of the smaller rosters in Division I baseball. It went 20-33 in 2025, its lowest winning percentage in five seasons.
NCAA Division IBig 12 ConferenceTexas
- Head coach
- Tim Tadlock
- Home venue
- Dan Law Field at Rip Griffin Park
- Average roster
- 42
- Five-year win rate
- 59%
Head Coach
players a season
Fit check
Do You Fit at Texas Tech University?
Pick your position and level, add a test score if you have one, and get an instant read on your chances here. Free, and no account needed.
Coaching staff
Get on This Staff's Radar
Head coach
Tim TadlockHead CoachEmail●●●●●●@●●●●.edu
Phone(●●●) ●●●-●●●●
Roster
Roster Breakdown
The roster by class
0FreshmenFr.
4SophomoresSo.
5JuniorsJr.
3SeniorsSr.
12 players on the latest roster (2027).
Roster openings after 2026-27
3players in their final year, 23% of the roster
Pitcher 2 · Catcher 1
See who you would be replacingRoster spots are shared by only 13 players, compared with a median of 39 among Division I baseball teams. Recruits may find a smaller group easier to break into.
Positions
Baseball Roster by Position
How many players a season the program carries at each position, and how tall they are.
Pitcher
18.7players a season
Average height 6'3"
Catcher
3.3players a season
Average height 5'11"
Infielder
6players a season
Average height 6'1"
Outfielder
2.7players a season
Average height 6'0"
Utility/Designated Hitter
0.3players a season
Average height 6'2"
Outfielders make up just 9% of the roster, about three per season, light compared with the 15% average among Division I baseball teams.
Footprint
Where This Team Recruits
Where the players are from
92players
In-state59.8%
Other US states38%
International2.2%
Counted from players on recent rosters with a known hometown.
Top home states
Texas60%
California8%
Washington4%
Florida4%
Georgia4%
Local ties run strong, with 60% of players from Texas compared with 40% for the median team among Division I baseball teams.
Results
Texas Tech University Baseball Recent Results
Swipe to see every season
Best season
2021
70%39-17overall
14-10conference
2022
64%39-22overall
15-9conference
2023
64%41-23overall
12-12conference
2024
56%33-26overall
12-17conference
Latest
2025
38%20-33overall
13-17conference
The team went 20-33 in 2025, its lowest-scoring year of the last five seasons by winning percentage. Over the last five seasons, a 59% winning percentage ranks in the top quarter among Division I baseball teams, where the median is 49%.
Schedule and travel
Baseball Schedule
The season's games, home and away, and how far the team travels.
Recruiting
Recruiting Outlook
Texas Tech baseball is a competitive NCAA Division I program in the Big 12 with a history of conference championships, NCAA Tournament appearances, and College World Series trips. The 2026 team reached the Big 12 Tournament but did not advance beyond its opening round, so the current opportunity is best viewed as competitive rather than elite. Most roster spots are likely to favor recruited athletes who can contribute immediately or show clear development potential.
Big 12 competition and high-level scheduleMultiple conference titles and College World Series appearances2026 roster reached the Big 12 Tournament
Recruiting difficulty
60/ 100Hard
OpenCompetitiveSelectiveElite
Texas Tech is a strong Power Four program where making the roster is difficult, but its recent results do not place it in the extremely selective national-contender tier.
What coaches value
- Pitchers with command, velocity, secondary-pitch quality, and the ability to handle high-pressure innings
- Position players who show consistent quality at-bats, defensive reliability, and athletic range
- Two-way ability and positional versatility that create more lineup or roster flexibility
- Physical development, competitive toughness, and a track record against strong Division I or elite amateur competition
How to get recruited here
Build a clear recruiting profile with verified measurables, recent video, academic information, and complete season statistics. Contact the baseball staff early, explain your projected role, and provide evidence that your skills translate against strong competition. Events, showcases, high-level travel baseball, and junior college or transfer experience can help provide relevant evaluation opportunities.
How hard is it to make the team
Making Texas Tech baseball is difficult because it competes in the Big 12 and regularly evaluates athletes from strong high school, travel, junior college, and transfer backgrounds. A prospect usually needs a clear Division I tool, strong defensive or pitching reliability, and evidence of continued physical and baseball development. Walk-on opportunities should not be assumed, so athletes should ask the staff about the current evaluation process rather than expect an open roster spot.
Who fits this program
- Competitive Big 12 baseball suits athletes ready for Division I schedules.
- Baseball players balance Division I demands with university academics.
- A large urban-campus setting suits traditional university lifestyles.
- Recruited athletes can contribute immediately or demonstrate development potential.
Program stats
The Program by the Numbers
40
Athletes on the roster
4
Coaches on staff
$40,861
Spent per athlete
Spending and revenue a year
Spending$6,242,693
Revenue$2,393,486
Revenue covers 38% of what the program spends.
Operating spending per athlete runs high, at about $47,000 in the 2025 EADA report, more than four times the Division I median. Costs outrun income in the same report, with about $6.2 million spent against $2.4 million in revenue, which covers 38% of the spending.
Source: the federal Equity in Athletics report, 2025.
Feeders
Top Feeder Schools and Clubs
The high schools and clubs that sent the most players to this roster.
1Friendswood High School2 players on recent rosters
2Montverde Academy2 players on recent rosters3Rockwall-Heath High School2 players on recent rosters4Rowlett High School2 players on recent rosters
5Southwest Christian School2 players on recent rosters
Repeat pipelines are common here, with Friendswood High School, Montverde Academy, and Rockwall-Heath High School each showing up with at least two players.
The school
School Environment
Texas Tech University combines engineering, business and applied research strengths with a broad academic environment, where recruits should weigh coursework demands, faculty access and career direction alongside their athletic goals.
 Texas Tech UniversityLubbock, TexasSee the full profile
73%
Acceptance rate
69%
Graduation rate
- Undergraduates
- 32,580
- Net price a year
- $19,070
- Earnings after ten years
- $62,454
Official links
Official Texas Tech University Baseball Links
Similar programs
Similar Baseball Teams
Programs at a similar level, with similar academics, worth adding to your recruiting list.


Big 12 competition, professional programs and Houston career opportunities appeal to athletes planning beyond their sport.

Accessible admissions, specialized academics and Sun Belt competition give recruits several distinct reasons to consider studying here.


Technical academics, accessible admissions and a residential Ruston setting complement the demands of Division I competition.

Competitive athletics, healthcare-focused academics and in-state affordability give recruits practical reasons to consider this Greenville campus.
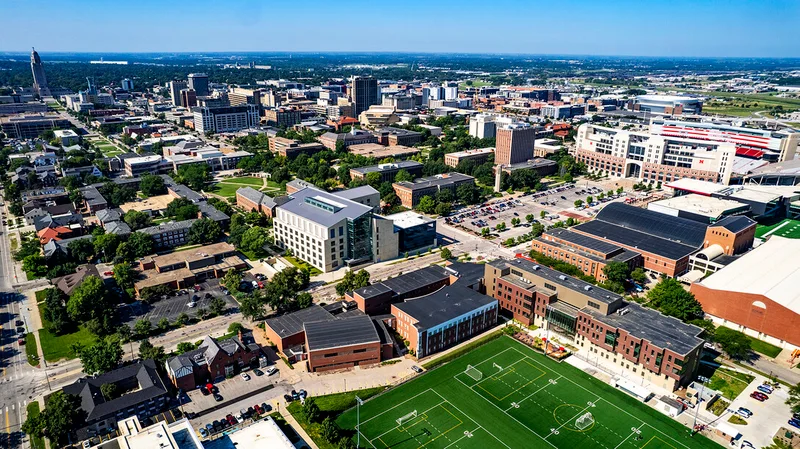

Big Ten competition, hands-on research and in-state value appeal to athletes seeking a broad university experience.
Teams in Texas
More Baseball Teams in Texas


Houston Christian University
Houston, TX
A small Christian community and Houston career connections give athletes reasons to look beyond the competition schedule.


University of the Incarnate Word
San Antonio, TX
Health-profession pathways, reachable faculty and Southland Conference competition appeal to athletes seeking career preparation alongside their sport.


Abilene Christian University
Abilene, TX
Christian community, reachable faculty and Division I competition appeal to athletes seeking connection beyond their sport.


Baylor University
Waco, TX
Competitive athletics, challenging academics and a Christian campus community give recruits distinct reasons to consider Baylor.


Lamar University
Beaumont, TX
Competitive athletics, affordable degree options and hands-on academics give recruits several reasons to consider this Beaumont campus.


Prairie View A&M University
Prairie View, TX
Engineering programs, an HBCU community and SWAC competition give athletes clear reasons to consider studying and competing here.
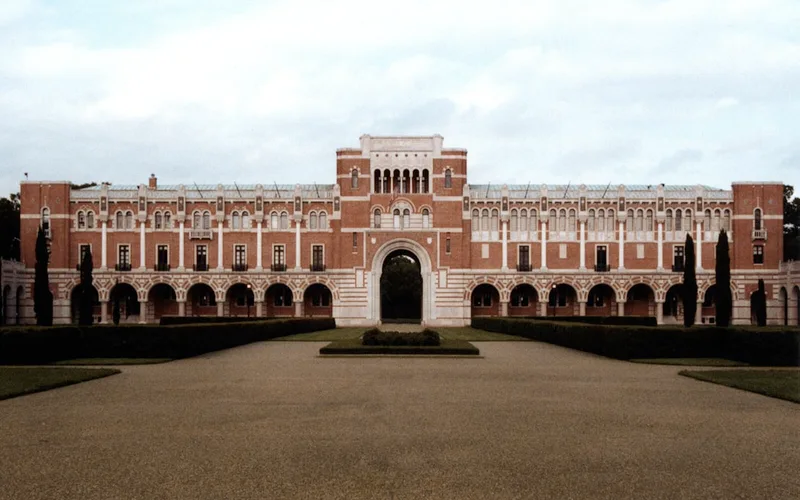

Rice University
Houston, TX
Challenging academics, close faculty connections and a residential college community complement the demands of Division I competition.


Sam Houston State University
Huntsville, TX
Career-focused programs, Conference USA competition and a traditional campus give athletes clear reasons to consider studying here.


Stephen F. Austin State University
Nacogdoches, TX
Specialized academics, Division I competition and small-town campus life give athletes distinct reasons to consider enrolling.


Tarleton State University
Stephenville, TX
Career-focused programs, accessible admissions and a community-oriented setting give athletes practical reasons to consider competing here.
Roster openings · 2026-27
Which D1 Baseball programs have the most roster spots opening up?
Every program ranked by players in their final year, with the positions they are losing.
10.2players leaving per program, on average
See the programs Three ways to start
Where are you in the search?
Pick the option that matches where you are, and we will show you the plan that fits.
Recruiting Plan
Your 20 to 25 best-fit schools, picked for you.



- Starter: the list, fit reads, real costs and a dated timeline
- Complete: adds roster reads and coach emails for every school
$99 or $249Starter or Complete, one time
Build my plan
Roster Report
The roster at your position, at the schools you pick.


- Who is graduating at your position, class year by class year
- Where spots are likely to open, in plain words
From $193, 8 or 15 schools
Choose my schools
School Plan
One school, covered end to end.
- Your honest odds, the roster and the verified coach
- Intro email, three follow-ups, admissions steps and timeline
$49One school, one time
Pick my school Resources