

Accessible admissions, practical academic strengths and relatively affordable costs make Lone Star Conference competition worth considering.

NCAA Division IILone Star ConferenceTexas

Texas A&M University-Kingsville Baseball
One plan built for Texas A&M University-Kingsville Baseball, with the roster read, the coach's contact and a dated plan, delivered within 24 hours. An expert checks every plan.
- 41
- Roster
- 95%
- In-state
Overview
Texas A&M University-Kingsville Baseball Team Details
Key facts about the Texas A&M University-Kingsville baseball team.
In Kingsville, Texas, Texas A&M University-Kingsville competes in Division II baseball through the Lone Star Conference. London High School leads its feeders by a wide margin, with four players to two for Alice High School. Roster continuity is a strength, as 88% of last season's non-seniors are back, above the 72% median among Division II baseball teams.
NCAA Division IILone Star ConferenceTexas
- Head coach
- Jason Gonzales
- Home venue
- Nolan Ryan Field
- Average roster
- 41
- Five-year win rate
- 52%
Head Baseball Coach
players a season
Fit check
Do You Fit at Texas A&M University-Kingsville?
Pick your position and level, add a test score if you have one, and get an instant read on your chances here. Free, and no account needed.
Coaching staff
Get on This Staff's Radar
Head coach
Jason GonzalesHead Baseball CoachEmail●●●●●●@●●●●.edu
Phone(●●●) ●●●-●●●●
Roster
Roster Breakdown
The roster by class
12FreshmenFr.
6SophomoresSo.
11JuniorsJr.
12SeniorsSr.
2GraduateGrad
43 players on the latest roster (2026).
Continuity is a strength, with 88% of last season's non-seniors back, ahead of the 72% median among Division II baseball teams. Coaches have brought in 21 players from other colleges, ahead of most teams among Division II baseball teams. A recruit should expect returning players to hold an edge for playing time.
Positions
Baseball Roster by Position
How many players a season the program carries at each position, and how tall they are.
Pitcher
17players a season
Average height 6'1"
Catcher
5players a season
Average height 5'11"
Infielder
9.7players a season
Average height 6'1"
Outfielder
7players a season
Average height 5'11"
Utility/Designated Hitter
2.3players a season
Average height 6'0"
Footprint
Where This Team Recruits
Where the players are from
122players
In-state95.1%
Other US states2.5%
International2.5%
Counted from players on recent rosters with a known hometown.
Top home states
Texas95%
Nebraska2%
Oklahoma1%
Home-state talent carries this roster: 95% of players are from Texas, versus 54% for the median team among Division II baseball teams.
Results
Texas A&M University-Kingsville Baseball Recent Results
Swipe to see every season
Best season
2022
62%33-20overall
28-16conference
2023
50%26-26overall
25-23conference
2024
46%23-27overall
21-27conference
2025
52%27-25overall
26-22conference
Latest
2026
49%26-27overall
25-25conference
This team sits in the middle of the pack, with a 52% winning percentage over five seasons and no year below 46% or above 62%.
Standings
Lone Star Conference Standings
Where Texas A&M University-Kingsville stands in the Lone Star Conference.
Schedule and travel
Baseball Schedule
The season's games, home and away, and how far the team travels.
Recruiting
Recruiting Outlook
Who fits this program
- Competes in NCAA Division II Lone Star Conference baseball
- Supports balance between baseball and moderate academic workload
- Campus offers a small-to-medium sized suburban environment
- Ideal for hardworking baseball players seeking regional development
Program stats
The Program by the Numbers
39
Athletes on the roster
4
Coaches on staff
$4,180
Spent per athlete
Spending and revenue a year
Spending$724,678
Revenue$605,050
Revenue covers 83% of what the program spends.
At roughly $5,900 per athlete in the 2025 EADA report, operating spending runs about twice the Division II median. The staff covers fewer athletes than usual: 39 athletes and four coaches in the same report, roughly 10 athletes per coach compared with a median of 13 among Division II baseball teams.
Source: the federal Equity in Athletics report, 2025.
Feeders
Top Feeder Schools and Clubs
The high schools and clubs that sent the most players to this roster.
1London High School4 players on recent rosters
2Alice High School2 players on recent rosters
3Bishop High School2 players on recent rosters
4Canyon High School2 players on recent rosters
5Harlingen High School2 players on recent rosters
London High School stands well apart, with four players against two from Alice High School, the next closest. Five sources have each placed at least two players across recent rosters.
The school
School Environment
At Texas A&M University-Kingsville, engineering, agriculture and wildlife sciences shape an academic profile worth exploring alongside admissions accessibility, coursework demands, faculty access, graduation outcomes and career opportunities across South Texas.
Texas A&M University-KingsvilleKingsville, TexasSee the full profile 91%
Acceptance rate
42%
Graduation rate
- Undergraduates
- 5,386
- Net price a year
- $12,090
- Earnings after ten years
- $51,450
Official links
Official Texas A&M University-Kingsville Baseball Links
Similar programs
Similar Baseball Teams
Programs at a similar level, with similar academics, worth adding to your recruiting list.


Personal instruction, professional programs and Lone Star Conference competition give athletes several reasons to consider this campus.
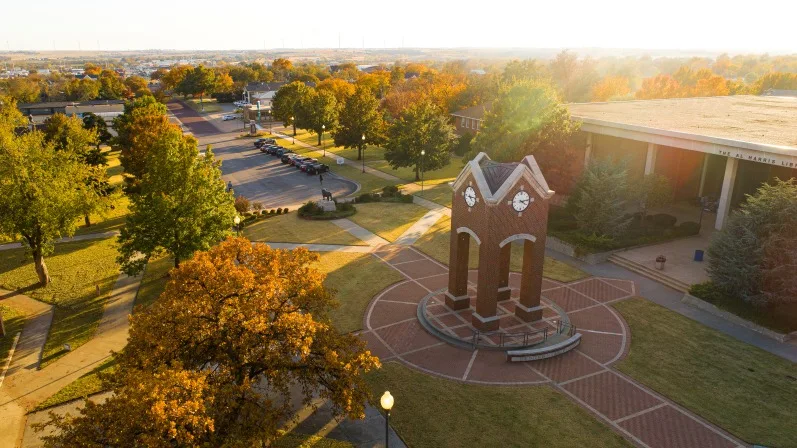

Southwestern Oklahoma State University
Weatherford, OK
Why it is similar: Similar level and academics.Professional programs, accessible admissions and a close-knit campus give athletes practical reasons to pursue competitive collegiate athletics here.
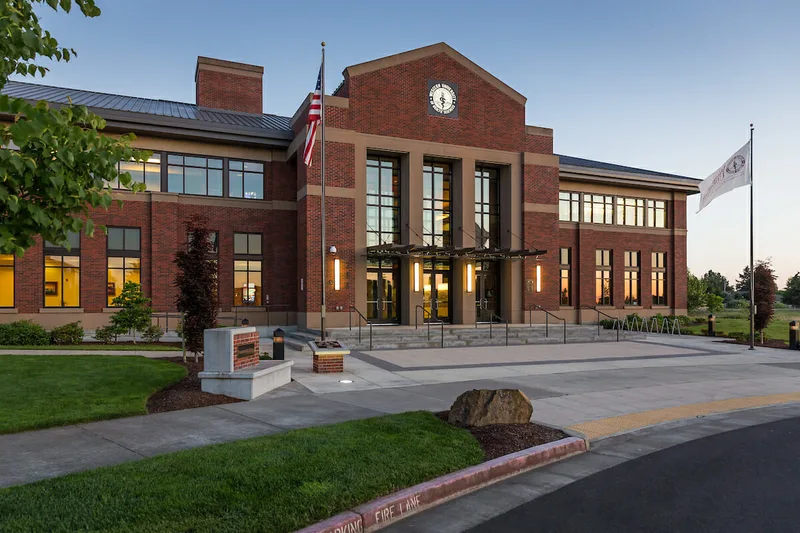

A small campus, approachable faculty and regional affordability appeal to athletes seeking competitive sports and personal connections.
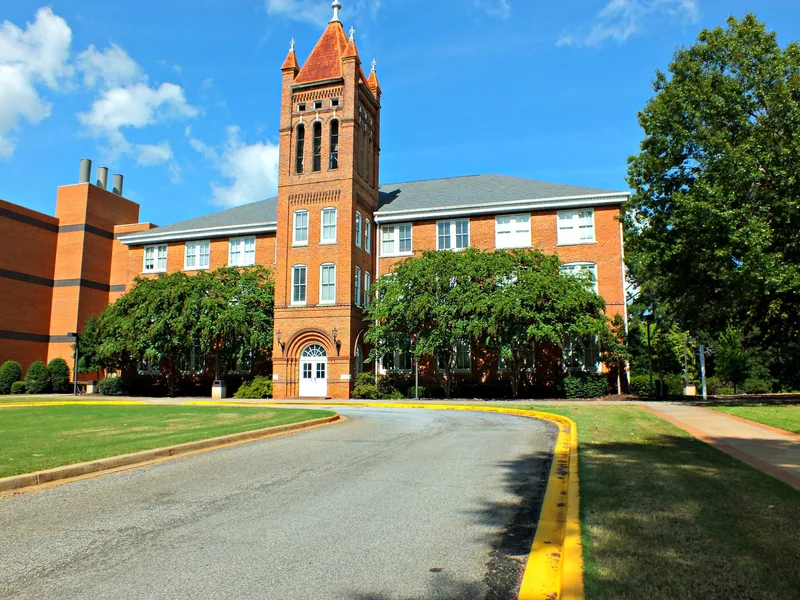

A close-knit campus, career-focused academics and Peach Belt competition give athletes a balanced college experience.


Accessible admissions, professional pathways and affordable tuition give athletes practical reasons to pursue a place here.
Teams in Texas
More Baseball Teams in Texas


Lubbock Christian University
Lubbock, TX
Athletes come for competitive conference play, personal mentoring and a campus community shaped by Christian faith.


St. Edward's University
Austin, TX
Close faculty relationships and Austin career opportunities complement a small-campus experience with Lone Star Conference competition.
St. Mary's University
San Antonio, TX
Personal instruction, professional programs and Lone Star Conference competition give athletes several reasons to consider this campus.


Texas A&M International University
Laredo, TX
Affordable costs and regionally focused academics give athletes practical reasons to pursue competitive Division II opportunities here.


The University of Texas at Tyler
Tyler, TX
Accessible admissions, career-focused academics and regional conference competition give athletes several practical reasons to consider this campus.
West Texas A&M University
Canyon, TX
Accessible admissions, practical academic strengths and relatively affordable costs make Lone Star Conference competition worth considering.


Sul Ross State University
Alpine, TX
Small classes, accessible admissions and a rural setting appeal to athletes seeking a more personal college experience.


University of Texas at Dallas
Richardson, TX
Career-focused academics, regional internships and expanding athletic opportunities give recruits practical reasons to consider studying here.


Angelo State University
San Angelo, TX
Conference competition, practical majors and scholarship opportunities appeal to athletes looking for a balanced West Texas college experience.


The University of Texas Permian Basin
Odessa, TX
Accessible admissions, regional career connections and affordable academics give athletes practical reasons to consider competing here.
Roster openings
Which D2 Baseball programs have the most roster spots opening up?
Every program ranked by players in their final year, with the positions they are losing.
11.6players leaving per program, on average
See the programs Three ways to start
Where are you in the search?
Pick the option that matches where you are, and we will show you the plan that fits.
Recruiting Plan
Your 20 to 25 best-fit schools, picked for you.



- Starter: the list, fit reads, real costs and a dated timeline
- Complete: adds roster reads and coach emails for every school
$99 or $249Starter or Complete, one time
Build my plan
Roster Report
The roster at your position, at the schools you pick.


- Who is graduating at your position, class year by class year
- Where spots are likely to open, in plain words
From $193, 8 or 15 schools
Choose my schools
School Plan
One school, covered end to end.
- Your honest odds, the roster and the verified coach
- Intro email, three follow-ups, admissions steps and timeline
$49One school, one time
Pick my school Resources