

Close faculty relationships, interdisciplinary study and NAIA competition appeal to athletes seeking a small residential college.
NAIACascade Collegiate ConferenceOregon

Oregon Institute of Technology Softball
One plan built for Oregon Institute of Technology Softball, with the roster read, the coach's contact and a dated plan, delivered within 24 hours. An expert checks every plan.
- 16
- Roster
- 3
- Leaving
- 61%
- In-state
- 0%
- Transfers
Overview
Oregon Institute of Technology Softball Team Details
Key facts about the Oregon Institute of Technology softball team.
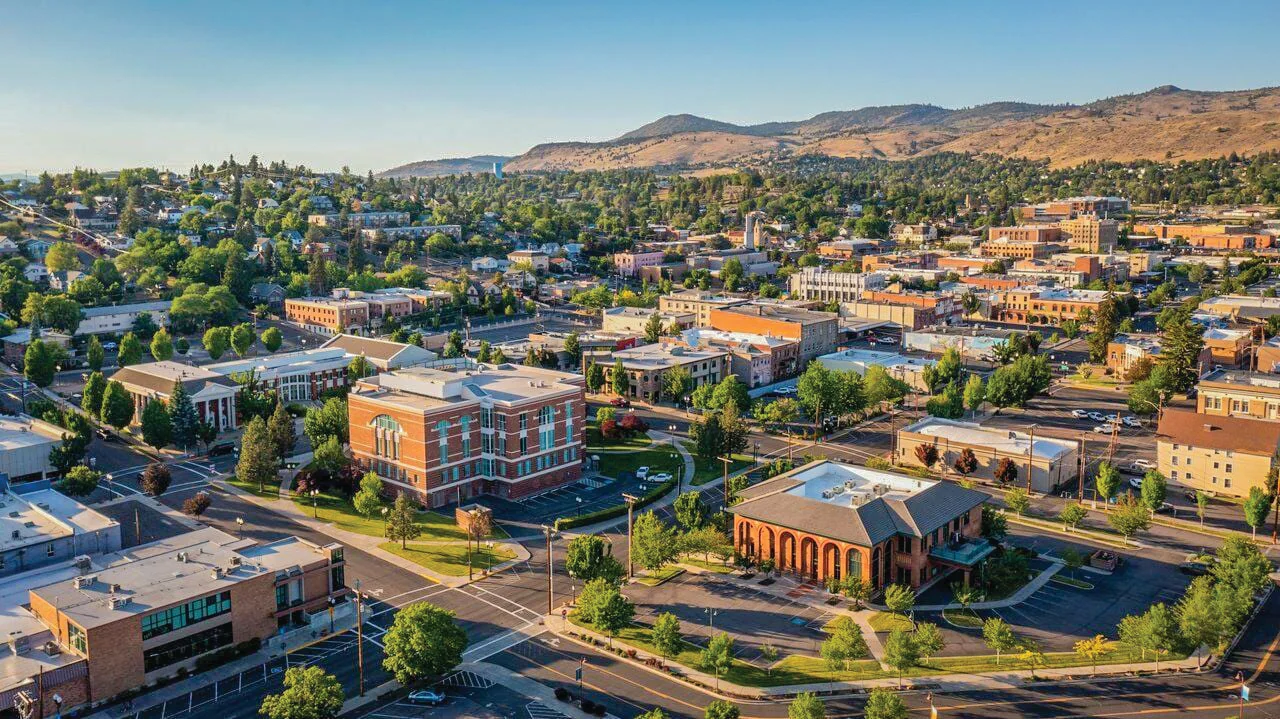
In Klamath Falls, Oregon, Oregon Institute of Technology competes in NAIA softball through the Cascade Collegiate Conference. It has finished above .500 in each of the last five seasons. Freshmen make up 44% of the roster, which makes it a young team.
NAIACascade Collegiate ConferencePacific NorthwestOregon
- Head coach
- Greg Stewart
- Home venue
- John and Lois Stilwell Stadium
- Average roster
- 17
- Five-year win rate
- 81%
Head Coach
players a season
Fit check
Do You Fit at Oregon Institute of Technology?
Pick your position and level, add a test score if you have one, and get an instant read on your chances here. Free, and no account needed.
Coaching staff
Get on This Staff's Radar
Head coach
Greg StewartHead CoachEmail●●●●●●@●●●●.edu
Phone(●●●) ●●●-●●●●
Roster
Roster Breakdown
The roster by class
7FreshmenFr.
1SophomoresSo.
5JuniorsJr.
3SeniorsSr.
16 players on the latest roster (2027).
Roster openings after 2026-27
3players in their final year, 19% of the roster
Pitcher 2 · Catcher 1
See who you would be replacingFirst-year players fill 44% of the roster, seven of 16, which makes this a youthful team. Coaches work with 16 players here, well below the 23 typical among NAIA softball teams.
Positions
Softball Roster by Position
How many players a season the program carries at each position, and how tall they are.
Pitcher
3.7players a season
Average height 5'7"
Catcher
2.3players a season
Average height 5'7"
Infielder
5.7players a season
Average height 5'6"
Outfielder
5players a season
Average height 5'7"
Utility/Designated Hitter
0.3players a season
Average height 5'4"
The roster carries fewer utility players and designated hitters than most NAIA softball teams, 2% of the roster against 11%, and carries more outfielders than most teams, 29% of the roster against 23%.
Footprint
Where This Team Recruits
Where the players are from
51players
In-state60.8%
Other US states39.2%
International0%
Counted from players on recent rosters with a known hometown.
Top home states
Oregon61%
California12%
Washington12%
Arizona6%
Idaho4%
Freshmen come from closer to campus than the roster as a whole, with 86% from Oregon against 56% of the current roster.
Results
Oregon Institute of Technology Softball Recent Results
Swipe to see every season
2022
79%50-13overall
25-5conference
Best season
2023
84%54-10overall
29-1conference
2024
80%49-12overall
24-3conference
2025
80%45-11overall
23-4conference
Latest
2026
81%43-10overall
20-4conference
A winning percentage of 81% over the last five seasons ranks in the top 10% among NAIA softball teams, ahead of the 50% median.
Standings
Cascade Collegiate Conference Standings
Where Oregon Institute of Technology stands in the Cascade Collegiate Conference.
Schedule and travel
Softball Schedule
The season's games, home and away, and how far the team travels.
Recruiting
Recruiting Outlook
Who fits this program
- Competes at the NAIA Cascade Collegiate Conference level
- Supports a balance between academics and softball training
- Located on a medium-sized rural campus with close student connections
- Ideal for dedicated softball players focused on technical career goals
Program stats
The Program by the Numbers
18
Athletes on the roster
3
Coaches on staff
$4,344
Spent per athlete
Spending and revenue a year
Spending$489,325
Revenue$490,313
Revenue covers everything the program spends.
With 18 athletes and three coaches in the 2025 EADA report, the staff works out to roughly six athletes per coach, against a median of 10 among NAIA softball teams. Operating spending per athlete runs high, at around $4,100 in the same report, about 69% above the NAIA median.
Source: the federal Equity in Athletics report, 2025.
The school
School Environment
Oregon Institute of Technology emphasizes applied engineering, health technologies and career preparation, making academic demands, faculty access and degree completion important considerations as you plan to balance coursework with athletics.
Oregon Institute of TechnologyKlamath Falls, OregonSee the full profile 95%
Acceptance rate
54%
Graduation rate
- Undergraduates
- 5,160
- Net price a year
- $15,706
- Earnings after ten years
- $72,273
Official links
Official Oregon Institute of Technology Softball Links
Similar programs
Similar Softball Teams
Programs at a similar level, with similar academics, worth adding to your recruiting list.


University of Science and Arts of Oklahoma
Chickasha, OK
Why it is similar: Similar level and academics.A small campus, interdisciplinary coursework and accessible costs appeal to athletes seeking a connected college experience.
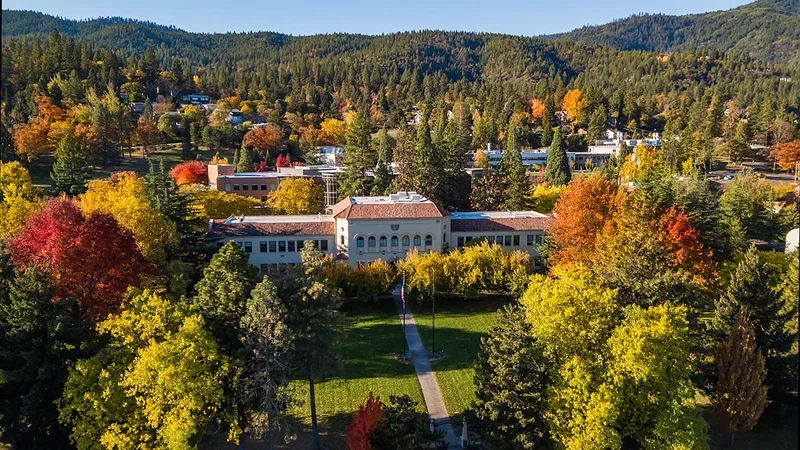

Competitive NAIA programs, accessible admissions and Ashland's creative culture give recruits distinct reasons to consider studying here.
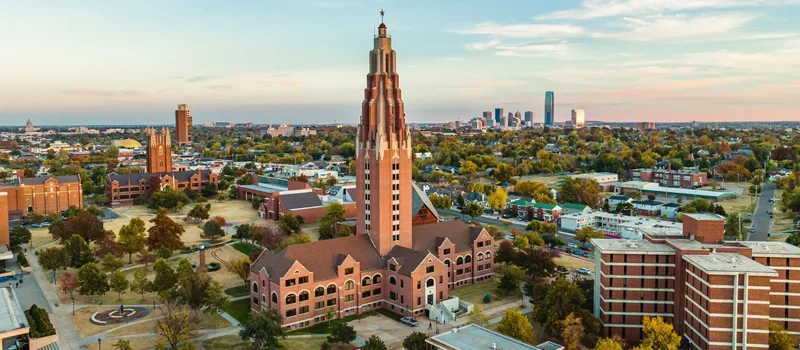

Athletes can pursue NAIA competition alongside specialized academics, approachable faculty and a close-knit urban campus community.

Athletes choose a close-knit Christian community where personal faculty support complements competitive Mid-South Conference athletics.


Strong health programs, NAIA competition and access to the Chicago area make St. Francis appealing to career-minded athletes.
Teams in Oregon
More Softball Teams in Oregon
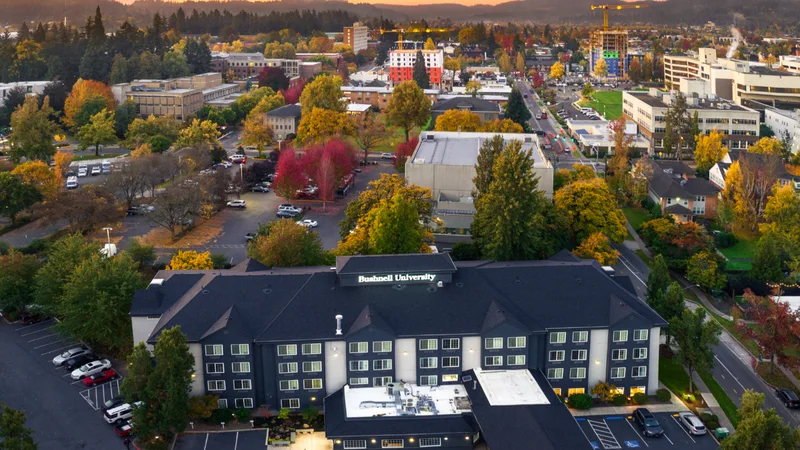

Bushnell University
Eugene, OR
Personal faculty attention, practical learning and Cascade Collegiate Conference competition give athletes several reasons to consider Bushnell.
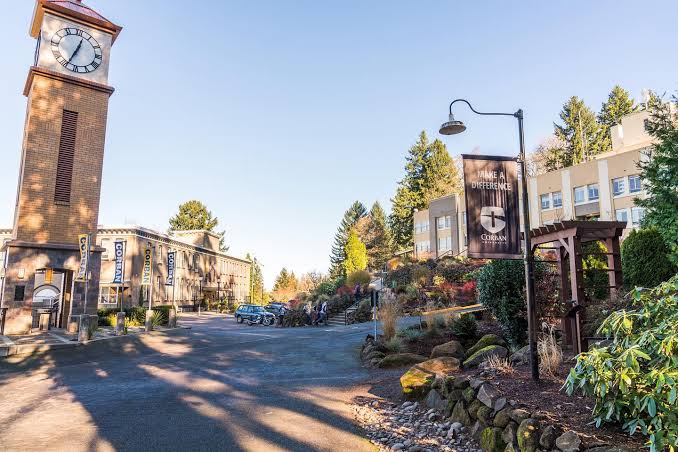

Corban University
Salem, OR
A Christ-centered education and close-knit residential community give athletes a setting where faith and competition fit together.


Eastern Oregon University
La Grande, OR
Small classes, accessible admissions and outdoor recreation make this rural campus worth considering alongside its NAIA competition.
Southern Oregon University
Ashland, OR
Competitive NAIA programs, accessible admissions and Ashland's creative culture give recruits distinct reasons to consider studying here.


Warner Pacific University
Portland, OR
A small campus community and career-focused coursework give athletes a personal academic experience alongside NAIA competition.
Roster openings · 2026-27
Which NAIA Softball programs have the most roster spots opening up?
Every program ranked by players in their final year, with the positions they are losing.
5players leaving per program, on average
See the programs Three ways to start
Where are you in the search?
Pick the option that matches where you are, and we will show you the plan that fits.
Recruiting Plan
Your 20 to 25 best-fit schools, picked for you.



- Starter: the list, fit reads, real costs and a dated timeline
- Complete: adds roster reads and coach emails for every school
$99 or $249Starter or Complete, one time
Build my plan
Roster Report
The roster at your position, at the schools you pick.


- Who is graduating at your position, class year by class year
- Where spots are likely to open, in plain words
From $193, 8 or 15 schools
Choose my schools
School Plan
One school, covered end to end.
- Your honest odds, the roster and the verified coach
- Intro email, three follow-ups, admissions steps and timeline
$49One school, one time
Pick my school Resources
Additional Resources
Pathley Softball hubRankings, divisions and programsSoftball recruiting timelineWhat to do each year of high schoolHow coaches evaluate college softballWhat coaches look for at this levelThe softball recruiting guideContact rules, emails and costsEvery NAIA Softball programThe full list, with filters