One plan built for Lindenwood University Baseball, with the roster read, the coach's contact and a dated plan, delivered within 24 hours. An expert checks every plan.
Key facts about the Lindenwood University baseball team.
The Ohio Valley Conference is the home league for Lindenwood University baseball, a Division I program in St. Charles, Missouri. It is an experienced group, with 12 of 34 players seniors or graduate students. Over five seasons it has a 42% winning percentage, in the bottom quarter among Division I baseball teams.
NCAA Division IOhio Valley ConferenceMissouri
Head coach
PJ Finigan
Baseball Head Coach
Home venue
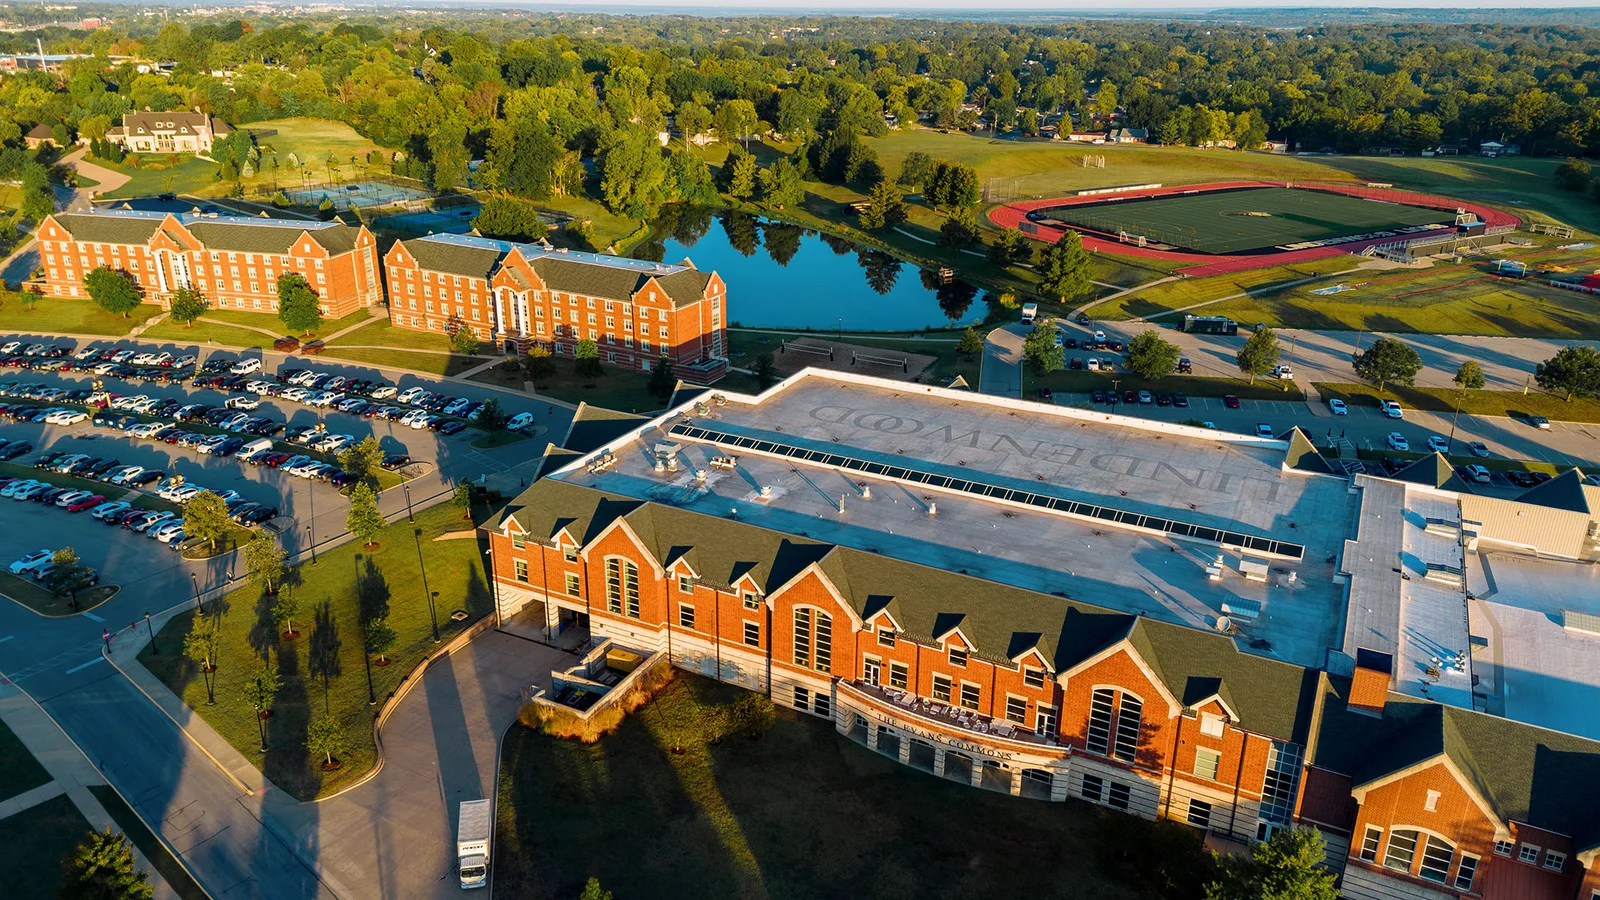
Lou Brock Sports Complex
Average roster
36
players a season
Five-year win rate
42%
Fit check
Do You Fit at Lindenwood University?
Pick your position and level, add a test score if you have one, and get an instant read on your chances here. Free, and no account needed.
Seniors and graduate students account for 35% of the current roster, 12 of 34 players, which makes this an experienced team. On the current roster, 15 of the 34 players came from other colleges, a share that is high among Division I baseball teams.
Positions
Baseball Roster by Position
How many players a season the program carries at each position, and how tall they are.
Pitcher
17.7players a season
Average height 6'2"
Catcher
3players a season
Average height 6'0"
Infielder
7.3players a season
Average height 6'1"
Outfielder
8.3players a season
Average height 6'0"
Coaches carry a lot of outfielders, roughly eight per season, or 23% of the roster, compared with 15% for the average team among Division I baseball teams.
Footprint
Where This Team Recruits
Where the players are from
109players
In-state43.1%
Other US states50.5%
International6.4%
Counted from players on recent rosters with a known hometown.
Top home states
Missouri43%
Illinois16%
California6%
Wisconsin6%
Louisiana4%
Results
Lindenwood University Baseball Recent Results
Swipe to see every season
Best season
2022
53%
27-24overall
16-12conference
2023
24%
13-42overall
8-16conference
2024
30%
16-38overall
9-18conference
2025
50%
30-30overall
14-12conference
Latest
2026
52%
30-28overall
13-14conference
Against a median of 49% among Division I baseball teams, this team has a 42% winning percentage over five seasons.
Schedule and travel
Baseball Schedule
The season's games, home and away, and how far the team travels.
Recruiting
Recruiting Outlook
Lindenwood baseball competes at the NCAA Division I level in the Ohio Valley Conference and has recently reached the conference tournament. The program is competitive, with roster experience spread across high school recruits, junior-college players, and four-year transfers, so prospects typically need a clear position fit and the ability to contribute in a demanding college environment.
NCAA Division I and Ohio Valley Conference competitionRecent OVC tournament participationRoster built from high school, junior-college, and transfer talent
Recruiting difficulty
60/ 100Hard
OpenCompetitiveSelectiveElite
This is a competitive Division I program where most roster opportunities require demonstrated college-level tools, consistency, and a strong positional fit.
What coaches value
Reliable position-specific tools, including bat speed, defensive range, arm strength, or pitching command
Pitchers who consistently locate multiple pitches and handle challenging counts
Defensive versatility and baseball IQ that can create value across roles
Strength, athletic development, and a consistent approach against quality competition
How to get recruited here
Build a complete recruiting profile with verified measurables, video against strong competition, and recent statistics. Contact the baseball staff early, explain your position fit, include academic information, and attend camps or recruiting events where your skills can be evaluated directly.
How hard is it to make the team
Making the team is moderately to highly difficult because Lindenwood competes in NCAA Division I and faces conference-level college talent throughout the season. The roster includes freshmen as well as junior-college and four-year transfers, so recruits should expect competition from experienced players and be ready to show an immediate role or strong developmental upside.
Who fits this program
Baseball players seeking competitive Division I and OVC competition.
Students balancing Division I training with career-oriented coursework.
A residential urban campus with a smaller overall student population.
Athletes prepared to contribute within a mixed-experience roster.
Videos
Lindenwood University Baseball Videos
Bradley vs Lindenwood (AMAZING GAME!) · 2025 College Baseball HighlightsPJ Finigan, Lindenwood (2025 OVC Baseball Championship - Game 9)Lindenwood University Baseball Sports Videography Reel 2022
Program stats
The Program by the Numbers
37
Athletes on the roster
3
Coaches on staff
$5,208
Spent per athlete
Spending and revenue a year
Spending$822,537
Revenue$822,537
Revenue covers everything the program spends.
Coaching time is shared widely, at about 12 athletes per coach in the 2025 EADA report, above the median of 10 among Division I baseball teams. The operating budget is below its peers: about $5,800 per athlete in the same report, about 43% below the Division I median.
Source: the federal Equity in Athletics report, 2025.
Feeders
Top Feeder Schools and Clubs
The high schools and clubs that sent the most players to this roster.
1Cbc2 players on recent rosters
2Collinsville High School2 players on recent rosters
Repeat pipelines are common here, with Cbc, Collinsville High School, and Francis Howell High each showing up with at least two players.
The school
School Environment
Lindenwood University emphasizes professional preparation through business, education, health sciences and fine arts, with experiential learning and internships helping you connect classroom work to career goals while pursuing your sport.
New camp dates are not posted yet. These ran last season.
Jan192026
Skills campBaseball · Men's
PJ Finigan Baseball Camp
Jan 19, 2026
Players Edge Performance, 3010 N. Highway 94, St. Charles, MO
$100
One-day skills camp for high-school players (pitchers and position players) led through Lindenwood-affiliated baseball staff; includes position-specific and pitching sessions.