
Close faculty relationships, NAIA competition and access to Grand Rapids employers make this small college worth considering.

NAIAWolverine-Hoosier Athletic ConferenceMichigan

Lawrence Technological University Baseball
One plan built for Lawrence Technological University Baseball, with the roster read, the coach's contact and a dated plan, delivered within 24 hours. An expert checks every plan.
- 48
- Roster
- 15
- Leaving
- 83%
- In-state
- 0%
- Transfers
Overview
Lawrence Technological University Baseball Team Details
Key facts about the Lawrence Technological University baseball team.
Based in Southfield, Michigan, Lawrence Technological University competes in the Wolverine-Hoosier Athletic Conference at the NAIA level in baseball. After the 2026-27 season, it loses seven pitchers, the most of any position group, followed by four catchers. The roster is stable, with 94% of last season's non-seniors back, above the 70% median among NAIA baseball teams.
NAIAWolverine-Hoosier Athletic ConferenceMidwestMichigan
- Head coach
- Stan Eldridge
- Home venue
- UWM Field
- Average roster
- 47
- Five-year win rate
- 52%
Head Coach
players a season
Fit check
Do You Fit at Lawrence Technological University?
Pick your position and level, add a test score if you have one, and get an instant read on your chances here. Free, and no account needed.
Coaching staff
Get on This Staff's Radar
Head coach
Stan EldridgeHead CoachEmail●●●●●●@●●●●.edu
Phone(●●●) ●●●-●●●●
Roster
Roster Breakdown
The roster by class
12FreshmenFr.
12SophomoresSo.
9JuniorsJr.
14SeniorsSr.
1GraduateGrad
48 players on the latest roster (2027).
Roster openings after 2026-27
15players in their final year, 31% of the roster
Pitcher 7 · Catcher 4 · Infielder 3 · Outfielder 1
Pitchers are where the Class of 2027 has the most room: seven leave after the 2026-27 season, followed by four catchers. For that class, the numbers are favorable, since 31% of the roster, 15 players, is set to leave after that season and the median among NAIA baseball teams is 24%.
See who you would be replacingFew players leave early here, with 94% of last year's freshmen, sophomores and juniors back, versus a 70% median among NAIA baseball teams.
Positions
Baseball Roster by Position
How many players a season the program carries at each position, and how tall they are.
Pitcher
25players a season
Average height 6'3"
Catcher
5.7players a season
Average height 6'2"
Infielder
8.7players a season
Average height 6'1"
Outfielder
6.7players a season
Average height 5'11"
Infielders make up just 19% of the roster, roughly nine per season, light compared with the 26% average among NAIA baseball teams.
Transfers
Transfers In and Out
0
transfers in for 2026-27
1
transfers out
- Share of the roster
- 0%
- Per 100 freshmen
- 0
Footprint
Where This Team Recruits
Where the players are from
12players
In-state83.3%
Other US states16.7%
International0%
Counted from players on recent rosters with a known hometown.
Top home states
Michigan83%
Ohio8%
Pennsylvania8%
Recruiting is largely local here, with 83% of players from Michigan, against a median of 41% among NAIA baseball teams.
Results
Lawrence Technological University Baseball Recent Results
Swipe to see every season
2021
44%11-14overall
5-7conference
2022
57%27-20overall
16-6conference
2023
48%24-26overall
17-13conference
Best season
2024
60%30-20overall
21-11conference
Latest
2025
46%19-22overall
13-15conference
A 52% winning percentage over five seasons makes this a middle-of-the-table team, with no single year below 44% or above 60%.
Schedule and travel
Baseball Schedule
The season's games, home and away, and how far the team travels.
Recruiting
Recruiting Outlook
Who fits this program
- NAIA baseball competition fostering real-game development
- Supports managing baseball with moderate STEM academic demands
- Small suburban campus providing a close community feel
- Ideal for players focused on skills growth and time management
Program stats
The Program by the Numbers
45
Athletes on the roster
6
Coaches on staff
$4,808
Spent per athlete
Spending and revenue a year
Spending$978,549
Revenue$918,061
Revenue covers 94% of what the program spends.
The program puts roughly $4,100 per athlete into operations in the 2025 EADA report, about twice the NAIA median. With 45 athletes and six coaches in the same report, the staff works out to about eight athletes per coach, against a median of 16 among NAIA baseball teams.
Source: the federal Equity in Athletics report, 2025.
Feeders
Top Feeder Schools and Clubs
The high schools and clubs that sent the most players to this roster.
1Anchor Bay High School2 players on recent rosters
The school
School Environment
At Lawrence Technological University, engineering, architecture and design shape an applied academic experience, with admissions, coursework, faculty access and career outcomes helping you judge the fit alongside your sport.
Lawrence Technological UniversitySouthfield, MichiganSee the full profile 56%
Acceptance rate
61%
Graduation rate
- Undergraduates
- 2,579
- Net price a year
- $32,918
- Earnings after ten years
- $69,151
Official links
Official Lawrence Technological University Baseball Links
Similar programs
Similar Baseball Teams
Programs at a similar level, with similar academics, worth adding to your recruiting list.

Career-focused programs, a wide range of NAIA sports and access to the Detroit area make this small Catholic university worth considering.


Close faculty relationships, career-focused majors and Crossroads League competition give athletes a clear mix of academic and athletic opportunities.

Athletes choose a faith-centered community where personal academic attention complements NAIA competition and a distinctive tuition pathway.

A close-knit campus and career-focused programs offer a practical setting for athletes balancing competition with college.

Close faculty relationships, a Christian community and NAIA competition appeal to athletes seeking a connected college experience.
Teams in Michigan
More Baseball Teams in Michigan
Aquinas College
Grand Rapids, MI
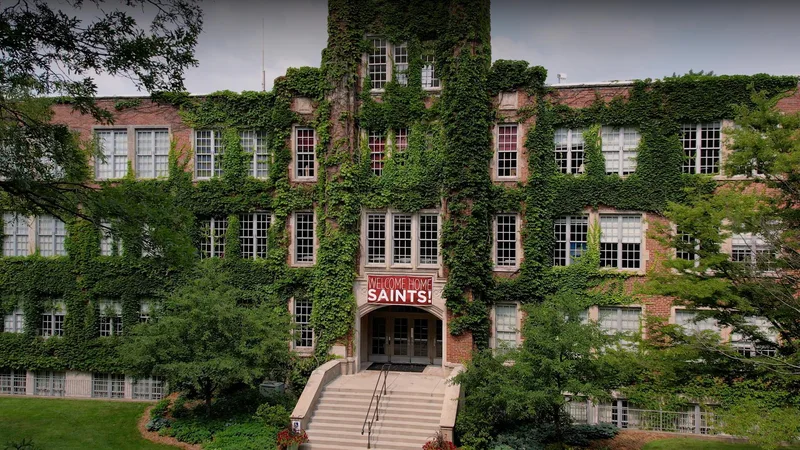
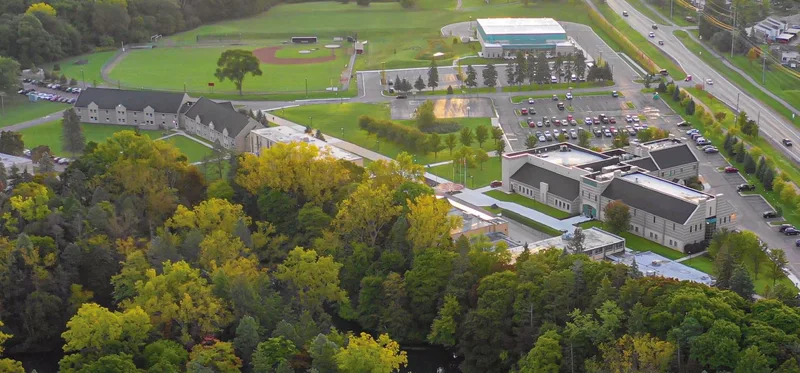
Close faculty relationships, NAIA competition and access to Grand Rapids employers make this small college worth considering.
Rochester Christian University
Rochester Hills, MI
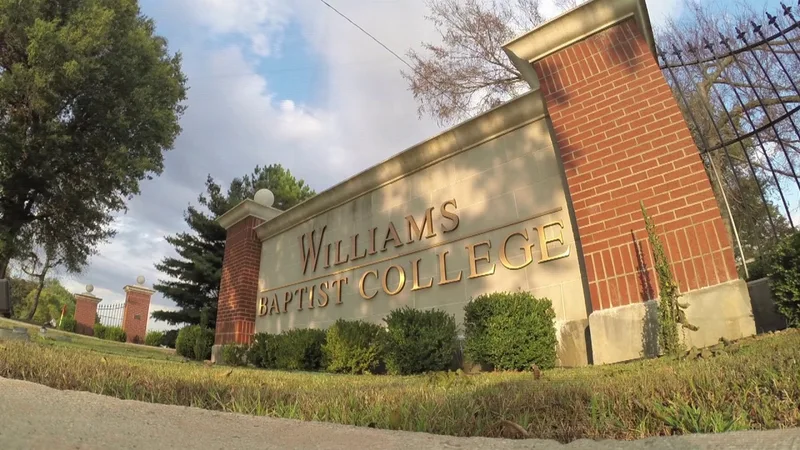
A close-knit community, career-focused majors and regional NAIA competition give athletes several reasons to consider this campus.

Cleary University
Howell, MI
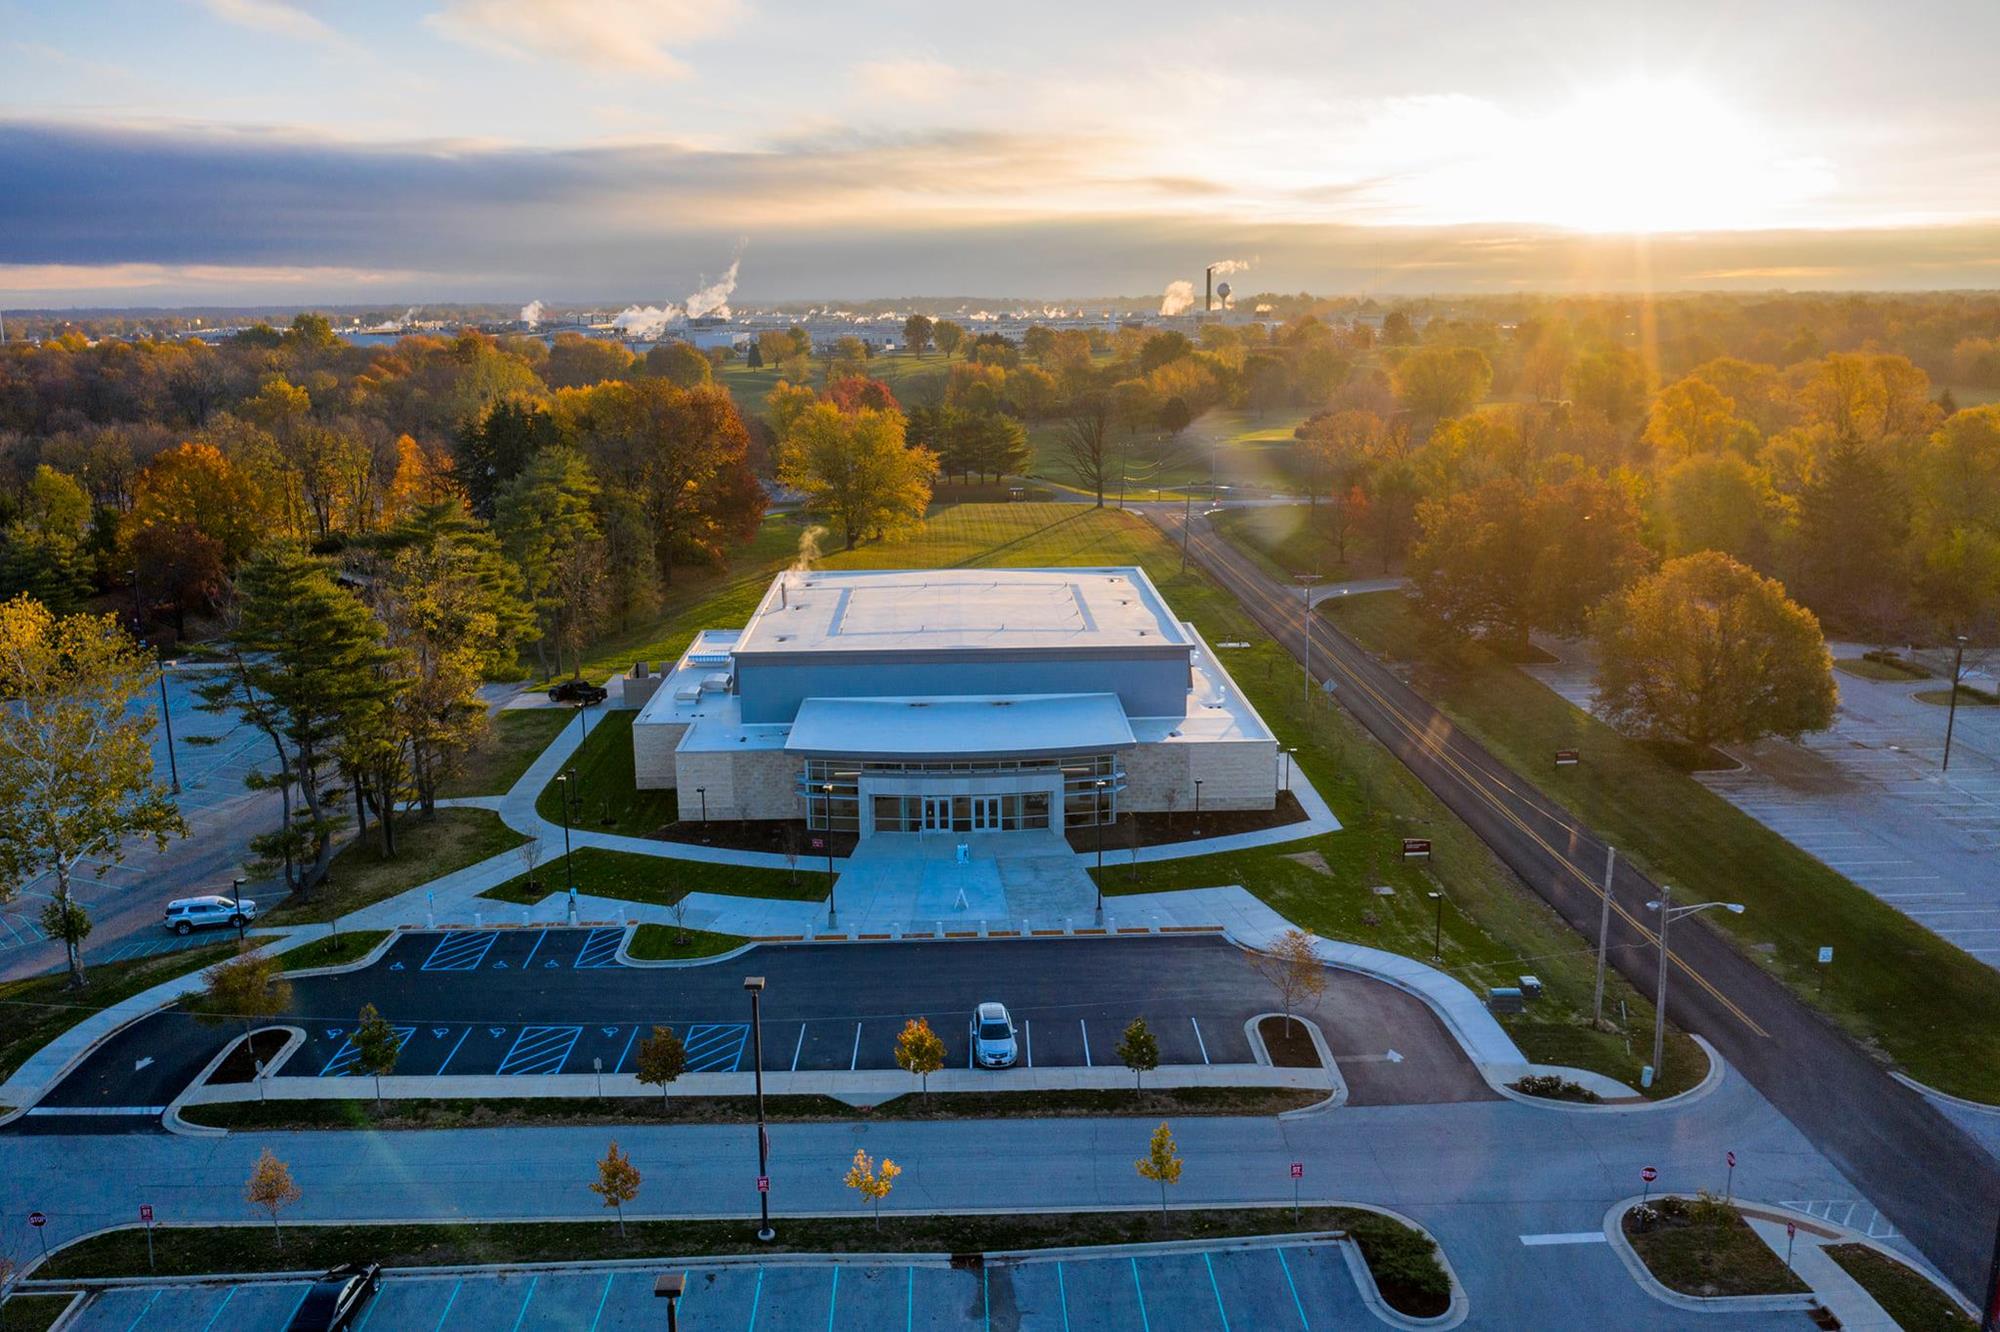
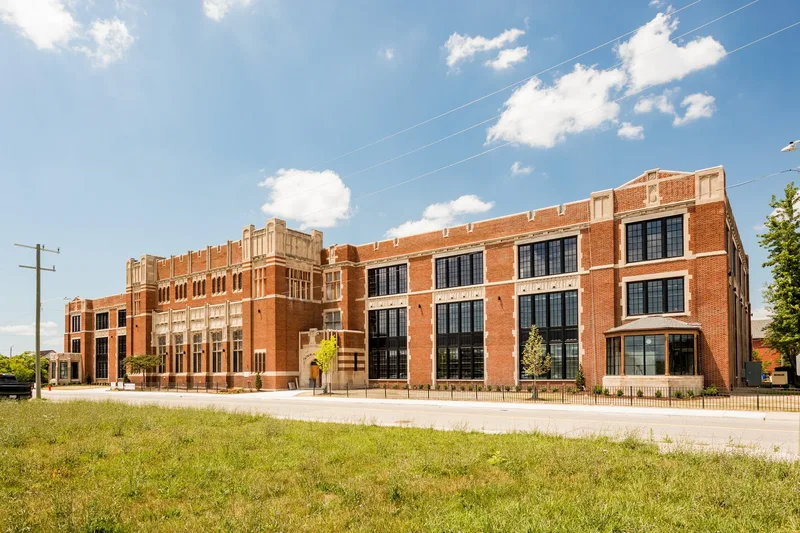
A small campus community and applied business education give athletes a focused setting for college competition.
Spring Arbor University
Spring Arbor, MI
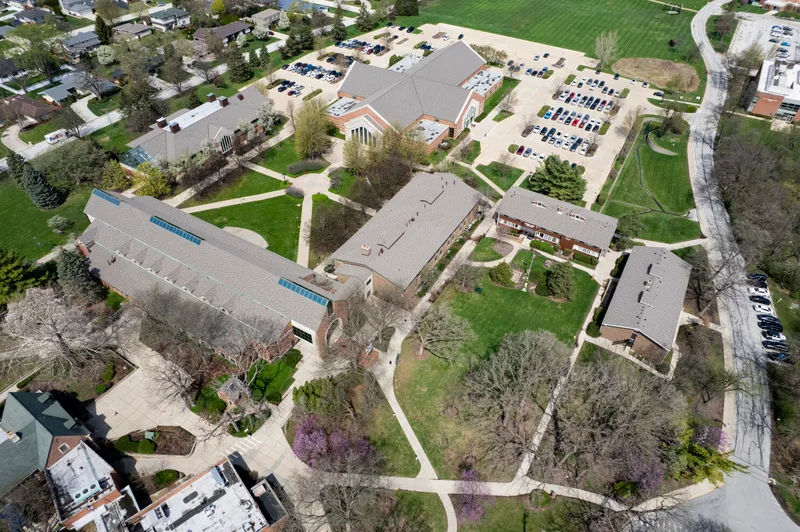
Close faculty relationships, career-focused majors and Crossroads League competition give athletes a clear mix of academic and athletic opportunities.
Roster openings · 2026-27
Which NAIA Baseball programs have the most roster spots opening up?
Every program ranked by players in their final year, with the positions they are losing.
11players leaving per program, on average
See the programs Three ways to start
Where are you in the search?
Pick the option that matches where you are, and we will show you the plan that fits.
Recruiting Plan
Your 20 to 25 best-fit schools, picked for you.



- Starter: the list, fit reads, real costs and a dated timeline
- Complete: adds roster reads and coach emails for every school
$99 or $249Starter or Complete, one time
Build my plan
Roster Report
The roster at your position, at the schools you pick.


- Who is graduating at your position, class year by class year
- Where spots are likely to open, in plain words
From $193, 8 or 15 schools
Choose my schools
School Plan
One school, covered end to end.
- Your honest odds, the roster and the verified coach
- Intro email, three follow-ups, admissions steps and timeline
$49One school, one time
Pick my school Resources
Additional Resources
Pathley Baseball hubRankings, divisions and programsBaseball recruiting timelineWhat to do each year of high schoolHow coaches evaluate college baseballWhat coaches look for at this levelThe baseball recruiting guideContact rules, emails and costsEvery NAIA Baseball programThe full list, with filters