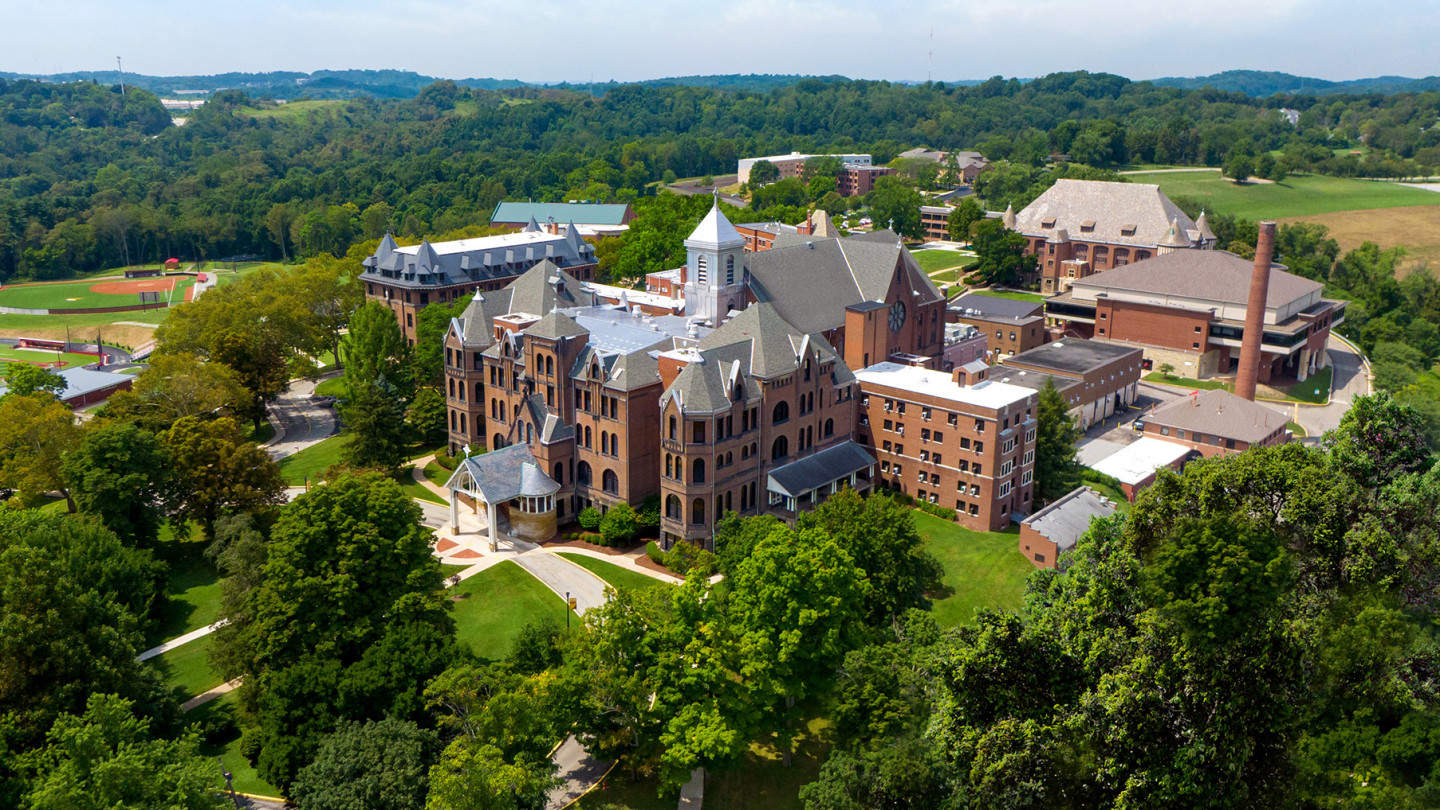

Competitive athletics, a close-knit community and career-focused learning give recruits several reasons to consider this campus.
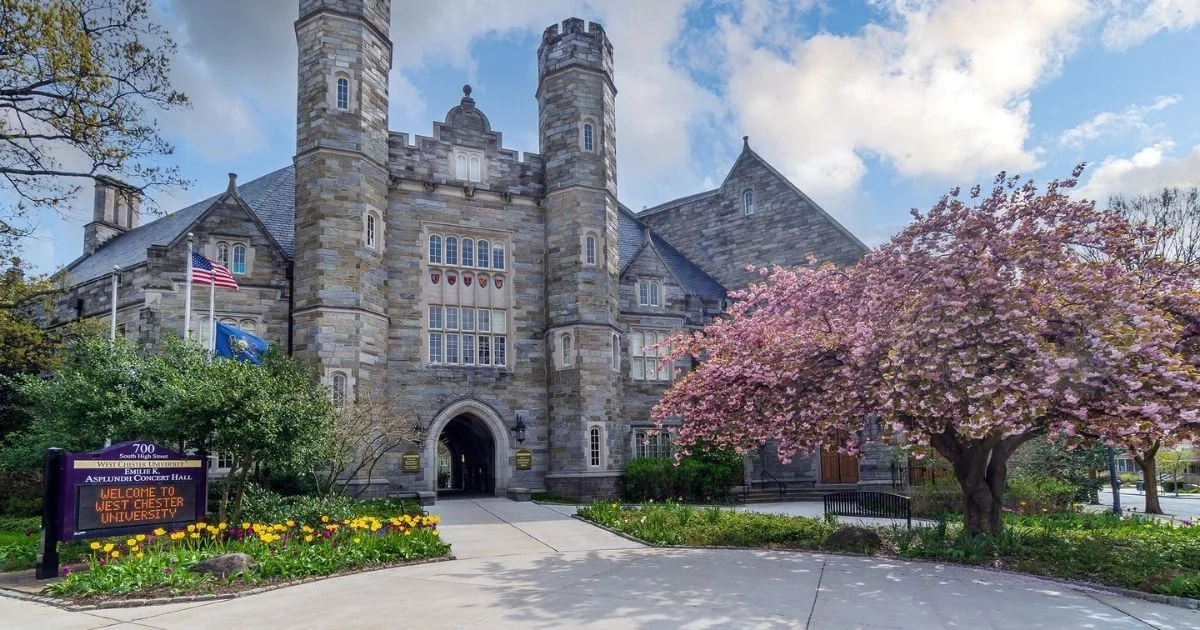
NCAA Division IIPennsylvania State Athletic ConferencePennsylvania

West Chester University of Pennsylvania Baseball
One plan built for West Chester University of Pennsylvania Baseball, with the roster read, the coach's contact and a dated plan, delivered within 24 hours. An expert checks every plan.
- 35
- Roster
- 69%
- In-state
Overview
West Chester University of Pennsylvania Baseball Team Details
Key facts about the West Chester University of Pennsylvania baseball team.
In West Chester, Pennsylvania, West Chester University of Pennsylvania competes in Division II baseball through the Pennsylvania State Athletic Conference. Five straight winning seasons run through 2026. Its players come from a tight circle of states, with the top five supplying 99% of the roster.
NCAA Division IIPennsylvania State Athletic ConferencePennsylvania
- Head coach
- Mike LaRosa
- Home venue
- Serpico Stadium
- Average roster
- 35
- Five-year win rate
- 73%
Head Coach
players a season
Fit check
Do You Fit at West Chester University of Pennsylvania?
Pick your position and level, add a test score if you have one, and get an instant read on your chances here. Free, and no account needed.
Coaching staff
Get on This Staff's Radar
Head coach
Mike LaRosaHead CoachEmail●●●●●●@●●●●.edu
Phone(●●●) ●●●-●●●●
Roster
Roster Breakdown
The roster by class
7FreshmenFr.
9SophomoresSo.
7JuniorsJr.
10SeniorsSr.
2GraduateGrad
35 players on the latest roster (2026).
Positions
Baseball Roster by Position
How many players a season the program carries at each position, and how tall they are.
Pitcher
14.7players a season
Average height 6'1"
Catcher
3.3players a season
Average height 5'11"
Infielder
8players a season
Average height 6'0"
Outfielder
8.3players a season
Average height 6'0"
Utility/Designated Hitter
0.3players a season
Average height 6'3"
Coaches carry a lot of outfielders, about eight per season, or 24% of the roster, compared with 17% for the average team among Division II baseball teams.
Footprint
Where This Team Recruits
Where the players are from
103players
In-state68.9%
Other US states31.1%
International0%
Counted from players on recent rosters with a known hometown.
Top home states
Pennsylvania69%
New Jersey20%
Delaware6%
Maryland3%
Ohio1%
Geography is tight here: the top five states supply 99% of players against an 88% median among Division II baseball teams. Recruiting has moved closer to home lately, since 86% of the freshman class is from Pennsylvania versus 69% of the roster as a whole.
Results
West Chester University of Pennsylvania Baseball Recent Results
Swipe to see every season
2022
71%36-15overall
17-7conference
2023
62%32-20overall
14-10conference
Best season
2024
83%43-9overall
25-7conference
2025
67%35-17overall
17-11conference
Latest
2026
80%48-12overall
21-7conference
Every season from 2022 to 2026 ended above .500, a run of five that adds up to a 73% winning percentage.
Standings
Pennsylvania State Athletic Conference Standings
Where West Chester University of Pennsylvania stands in the Pennsylvania State Athletic Conference.
Schedule and travel
Baseball Schedule
The season's games, home and away, and how far the team travels.
Recruiting
Recruiting Outlook
Who fits this program
- Competes in NCAA Division II’s Pennsylvania State Athletic Conference
- Supports athletes balancing moderate academics with sports demands
- Offers a vibrant suburban campus lifestyle with active student groups
- Best for baseball players ready to compete for playing roles
Program stats
The Program by the Numbers
34
Athletes on the roster
5
Coaches on staff
$4,449
Spent per athlete
Spending and revenue a year
Spending$305,610
Revenue$366,976
Revenue covers everything the program spends.
The staff covers fewer athletes than usual: 34 athletes and five coaches in the 2025 EADA report, about seven athletes per coach versus a median of 13 among Division II baseball teams. Reported revenue of about $370,000 in the same report exceeds spending of $310,000, a gap of 20% of expenses.
Source: the federal Equity in Athletics report, 2025.
Feeders
Top Feeder Schools and Clubs
The high schools and clubs that sent the most players to this roster.
1Archbishop Wood High School2 players on recent rosters2Avon Grove HS2 players on recent rosters3Cherry Hill High School West2 players on recent rosters4Coatesville Area SHS2 players on recent rosters5Father Judge High School2 players on recent rosters
Pipelines repeat here: five schools or clubs have each placed two or more players, and that group includes Archbishop Wood High School.
The school
School Environment
At West Chester University of Pennsylvania, strengths in education, business, health sciences and music shape an academic profile that athletes can weigh alongside coursework demands, faculty access and career outcomes.
West Chester University of PennsylvaniaWest Chester, PennsylvaniaSee the full profile 78%
Acceptance rate
71%
Graduation rate
- Undergraduates
- 14,449
- Net price a year
- $23,331
- Earnings after ten years
- $61,258
Official links
Official West Chester University of Pennsylvania Baseball Links
Similar programs
Similar Baseball Teams
Programs at a similar level, with similar academics, worth adding to your recruiting list.
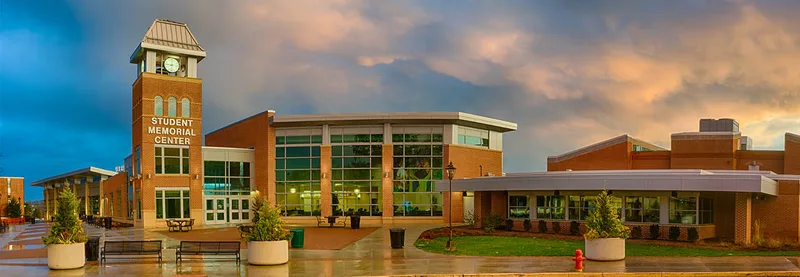

Millersville University of Pennsylvania
Millersville, PA
Why it is similar: Same conference and state.Athletes choose this campus for PSAC competition, teacher preparation, in-state value and access to nearby Lancaster.
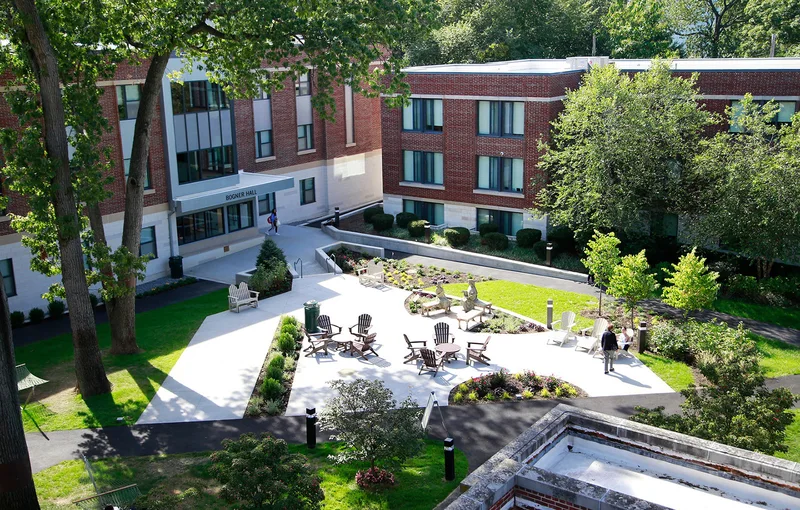

Personal faculty access and career-focused programs give athletes reasons to look beyond the competition alone.


Downtown opportunities, approachable admissions and career-focused learning give athletes reasons to consider this small urban university.


Athletes find competitive programs, close faculty connections and career preparation within a supportive Sioux Falls community.


A close-knit Christian community and career-focused academics complement competitive athletics and opportunities to study abroad.
Teams in Pennsylvania
More Baseball Teams in Pennsylvania
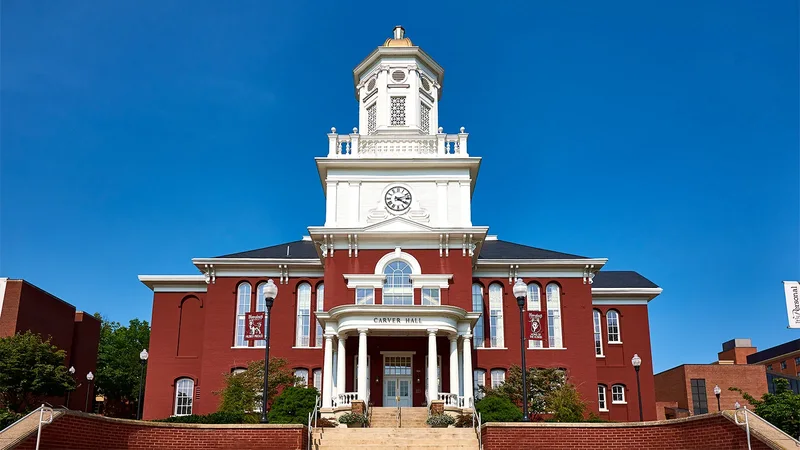

Bloomsburg University of Pennsylvania
Bloomsburg, PA
Career-focused majors, regional competition and in-state value appeal to athletes who want a residential college experience.


Pennsylvania Western University, California
California, PA
Accessible admissions, career-focused study and PSAC competition give athletes practical reasons to consider this small-town campus.
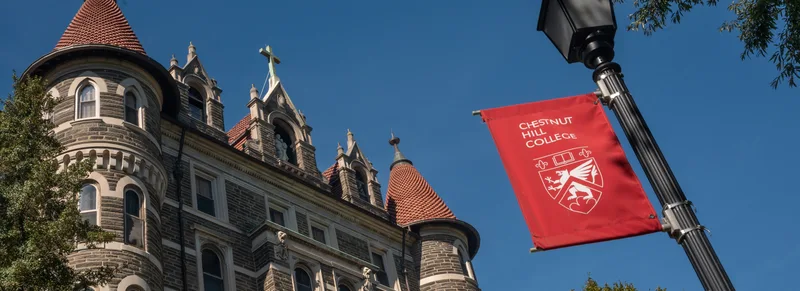

Chestnut Hill College
Philadelphia, PA
Close faculty connections, conference competition and access to Philadelphia give athletes reasons to consider this small college.
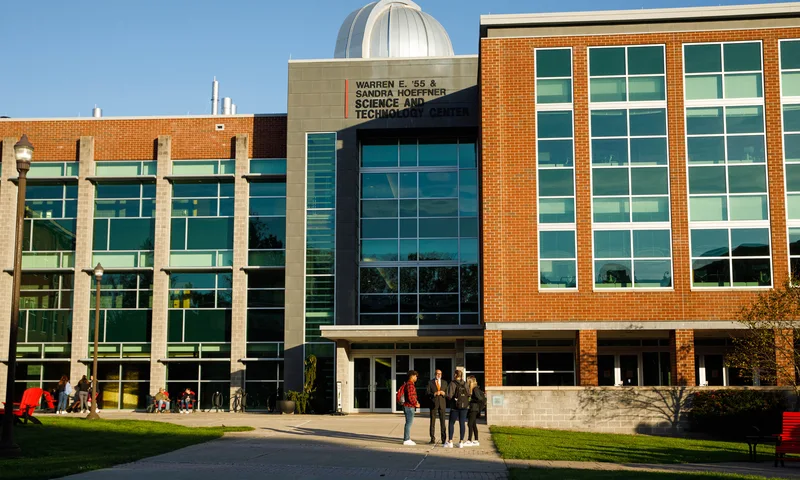

East Stroudsburg University of Pennsylvania
East Stroudsburg, PA
Career-focused programs, accessible admissions and PSAC competition give athletes practical reasons to consider studying and competing here.
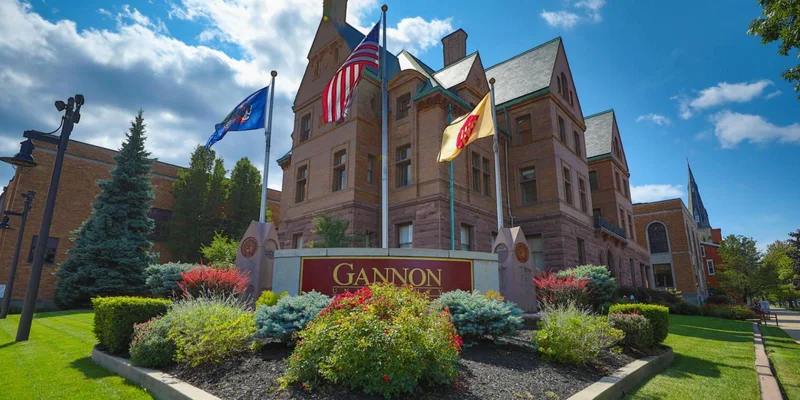

Gannon University
Erie, PA
Athletes choose this small university for competitive athletics, career-focused academics and a close-knit downtown campus community.
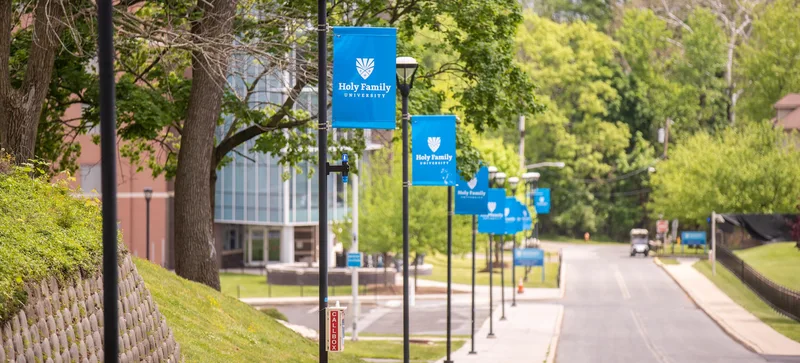

Holy Family University
Philadelphia, PA
Career-focused academics, a small community and Philadelphia access give athletes practical reasons to consider competing here.
Millersville University of Pennsylvania
Millersville, PA
Athletes choose this campus for PSAC competition, teacher preparation, in-state value and access to nearby Lancaster.
Point Park University
Pittsburgh, PA
Downtown opportunities, approachable admissions and career-focused learning give athletes reasons to consider this small urban university.
Seton Hill University
Greensburg, PA
Competitive athletics, a close-knit community and career-focused learning give recruits several reasons to consider this campus.
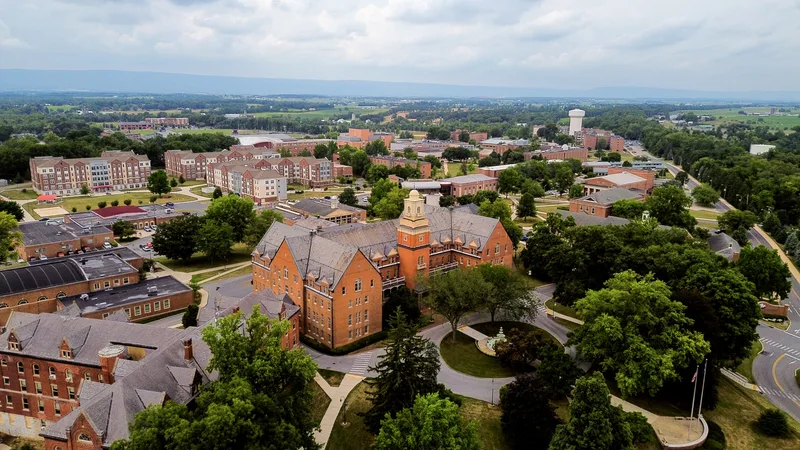

Shippensburg University of Pennsylvania
Shippensburg, PA
Career-focused programs, accessible admissions and competitive conference athletics make this a practical option for recruits.
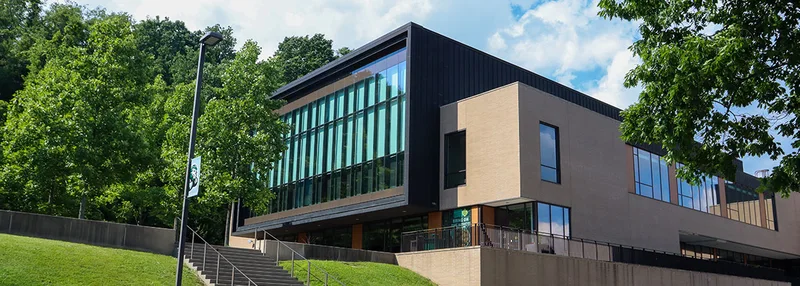

Slippery Rock University of Pennsylvania
Slippery Rock, PA
Career-oriented programs, accessible admissions and regional athletic competition make this a practical option for college-bound athletes.
Roster openings
Which D2 Baseball programs have the most roster spots opening up?
Every program ranked by players in their final year, with the positions they are losing.
11.6players leaving per program, on average
See the programs Three ways to start
Where are you in the search?
Pick the option that matches where you are, and we will show you the plan that fits.
Recruiting Plan
Your 20 to 25 best-fit schools, picked for you.



- Starter: the list, fit reads, real costs and a dated timeline
- Complete: adds roster reads and coach emails for every school
$99 or $249Starter or Complete, one time
Build my plan
Roster Report
The roster at your position, at the schools you pick.


- Who is graduating at your position, class year by class year
- Where spots are likely to open, in plain words
From $193, 8 or 15 schools
Choose my schools
School Plan
One school, covered end to end.
- Your honest odds, the roster and the verified coach
- Intro email, three follow-ups, admissions steps and timeline
$49One school, one time
Pick my school Resources