

Close faculty relationships and institutional scholarships complement competitive athletics within a small Christian campus community.

NAIAMid-South ConferenceKentucky

University of the Cumberlands Women's Basketball
One plan built for University of the Cumberlands Women's Basketball, with the roster read, the coach's contact and a dated plan, delivered within 24 hours. An expert checks every plan.
- 15
- Roster
- 0
- Leaving
- 42%
- In-state
- 7%
- Transfers
Overview
University of the Cumberlands Women's Basketball Team Details
Key facts about the University of the Cumberlands women's basketball team.
University of the Cumberlands runs a women's basketball team in Williamsburg, Kentucky, competing in the Mid-South Conference at the NAIA level. It has finished above .500 in each of the last five seasons. Freshmen make up 64% of the roster, which makes it a young team.
NAIAMid-South ConferenceSoutheastKentucky
- Head coach
- Rick Reeves
- Home venue
- O. Wayne Rollins Center
- Average roster
- 15
- Five-year win rate
- 70%
Head Coach
players a season
Fit check
Do You Fit at University of the Cumberlands?
Pick your position and level, add a test score if you have one, and get an instant read on your chances here. Free, and no account needed.
Coaching staff
Get on This Staff's Radar
Head coach
Rick ReevesHead CoachEmail●●●●●●@●●●●.edu
Phone(●●●) ●●●-●●●●
Roster
Roster Breakdown
The roster by class
9FreshmenFr.
4SophomoresSo.
1JuniorsJr.
0SeniorsSr.
14 players on the latest roster (2026-27).
Roster openings after 2026-27
0players in their final year, 0% of the roster
See who you would be replacing Youth defines this roster: nine of 14 players are freshmen, or 64%. Turnover is high, with only 40% of last season's freshmen, sophomores and juniors listed this year, compared with a median of 67% among NAIA women's basketball teams. Transfers make up just 7% of the roster, in the bottom 10% among NAIA women's basketball teams, where the median is 24%.
Positions
Women's Basketball Roster by Position
How many players a season the program carries at each position, and how tall they are.
Guard
8.3players a season
Average height 5'8"
Forward
3.3players a season
Average height 6'0"
Center
3players a season
Average height 6'3"
Transfers
Transfers In and Out
1
transfers in for 2026-27
2
transfers out
- Share of the roster
- 7%
- Per 100 freshmen
- 11
- By position
- Forward 1
- Came from
- 1 from Division II
Footprint
Where This Team Recruits
Where the players are from
45players
In-state42.2%
Other US states48.9%
International8.9%
Counted from players on recent rosters with a known hometown.
Top home states
Kentucky42%
Tennessee20%
Virginia16%
Georgia4%
Indiana2%
Results
University of the Cumberlands Women's Basketball Recent Results
Swipe to see every season
2021-22
61%20-13overall
13-9conference
2022-23
75%24-8overall
16-6conference
2023-24
72%26-10overall
8-4conference
Best season
2024-25
81%26-6overall
10-2conference
Latest
2025-26
61%19-12overall
3-9conference
Winning has been steady here, with five consecutive winning seasons and a 70% winning percentage since 2021-22. By contrast, the 2025-26 season was a step back from 2024-25: 19-12 after 26-6, with winning percentage down 20 points. Conference results were the harder part of 2025-26: 3-9 in Mid-South Conference play compared with 19-12 overall.
Standings
Mid-South Conference Standings
Where University of the Cumberlands stands in the Mid-South Conference.
Schedule and travel
Women's Basketball Schedule
The season's games, home and away, and how far the team travels.
Recruiting
Recruiting Outlook
Who fits this program
- NAIA competition emphasizing teamwork and discipline
- Academic flexibility supports balancing basketball and studies
- Rural campus fosters close-knit community and focus
- Designed for self-motivated women basketball players valuing structure
Program stats
The Program by the Numbers
17
Athletes on the roster
3
Coaches on staff
$6,090
Spent per athlete
Spending and revenue a year
Spending$456,170
Revenue$456,170
Revenue covers everything the program spends.
According to the 2025 EADA report, the program spends roughly $5,800 per athlete on operations, about 72% above the NAIA median.
Source: the federal Equity in Athletics report, 2025.
Feeders
Top Feeder Schools and Clubs
The high schools and clubs that sent the most players to this roster.
1Clarkrange High School2 players on recent rosters
2Whitefield Academy2 players on recent rosters
The school
School Environment
University of the Cumberlands combines broad undergraduate choices with a professional academic focus, giving athletes options in business, education and health fields while considering classroom demands and degree completion.
University of the CumberlandsWilliamsburg, KentuckySee the full profile 99%
Acceptance rate
50%
Graduation rate
- Undergraduates
- 7,612
- Net price a year
- $14,107
- Earnings after ten years
- $45,036
Official links
Official University of the Cumberlands Women's Basketball Links
Similar programs
Similar Basketball Teams
Programs at a similar level, with similar academics, worth adding to your recruiting list.


A Christian campus community and career-focused majors give athletes reasons to look beyond their athletic fit.


Competitive NAIA athletics, career-focused majors and a small residential community give recruits several reasons to consider enrolling.


Technology-focused academics, NAIA competition and a small campus appeal to athletes seeking a career-oriented college experience.


Competitive athletics, approachable faculty and city internship opportunities give recruits reasons to look closely at Marian.


Personal faculty access, affordable public tuition and regional career connections complement the opportunity to compete in NAIA athletics.
Teams in Kentucky
More Basketball Teams in Kentucky


Alice Lloyd College
Pippa Passes, KY
A small campus, required student work and NAIA competition appeal to athletes seeking a practical college experience.
Campbellsville University
Campbellsville, KY
A Christian campus community and career-focused majors give athletes reasons to look beyond their athletic fit.
Georgetown College
Georgetown, KY
Close faculty relationships and institutional scholarships complement competitive athletics within a small Christian campus community.
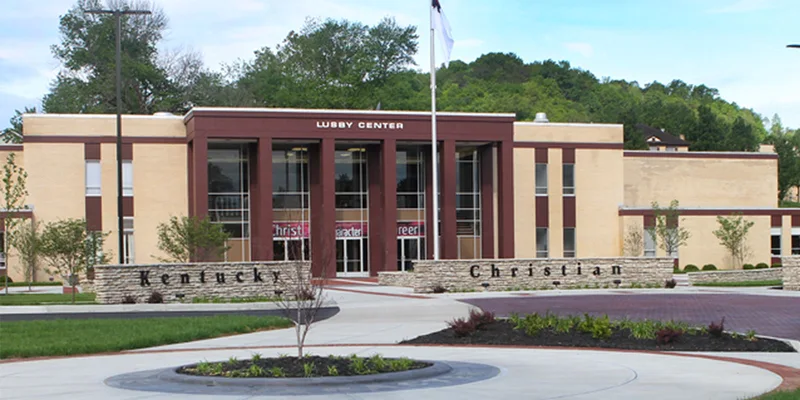

Kentucky Christian University
Grayson, KY
NAIA competition, accessible faculty and a close-knit residential community give athletes a personal place to pursue their goals.
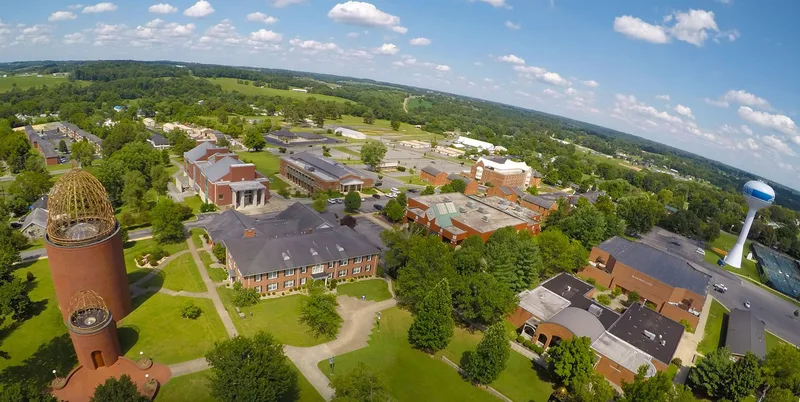

Lindsey Wilson University
Columbia, KY
Championship experience, professional study options and a close-knit campus give athletes distinct reasons to consider Lindsey Wilson.


Union Commonwealth University
Barbourville, KY
NAIA competition, approachable faculty and a small residential community appeal to athletes seeking a personal college experience.


University of Pikeville
Pikeville, KY
A small campus, health career pathways and NAIA competition give athletes distinct reasons to consider studying here.

Brescia University
Owensboro, KY
Close faculty connections, professional programs and NAIA competition appeal to athletes seeking a smaller college community.


Midway University
Midway, KY
Athletes come for NAIA competition, career-focused programs, a close-knit community and opportunities for scholarship support.
Roster openings · 2026-27
Which NAIA Women's Basketball programs have the most roster spots opening up?
Every program ranked by players in their final year, with the positions they are losing.
3.5players leaving per program, on average
See the programs Three ways to start
Where are you in the search?
Pick the option that matches where you are, and we will show you the plan that fits.
Recruiting Plan
Your 20 to 25 best-fit schools, picked for you.



- Starter: the list, fit reads, real costs and a dated timeline
- Complete: adds roster reads and coach emails for every school
$99 or $249Starter or Complete, one time
Build my plan
Roster Report
The roster at your position, at the schools you pick.


- Who is graduating at your position, class year by class year
- Where spots are likely to open, in plain words
From $193, 8 or 15 schools
Choose my schools
School Plan
One school, covered end to end.
- Your honest odds, the roster and the verified coach
- Intro email, three follow-ups, admissions steps and timeline
$49One school, one time
Pick my school Resources
Additional Resources
Pathley Basketball hubRankings, divisions and programsBasketball recruiting timelineWhat to do each year of high schoolHow coaches evaluate college basketballWhat coaches look for at this levelThe basketball recruiting guideContact rules, emails and costsEvery NAIA Women's Basketball programThe full list, with filters