Pathley
Build My Plan
Contact us Build My Plan
University of Nevada, Reno Baseball
NCAA Division IMountain West ConferenceNevada

University of Nevada, Reno Baseball

One plan built for University of Nevada, Reno Baseball, with the roster read, the coach's contact and a dated plan, delivered within 24 hours. An expert checks every plan.

38
Roster
30%
In-state

Overview

University of Nevada, Reno Baseball Team Details

Key facts about the University of Nevada, Reno baseball team.

From its campus in Reno, Nevada, University of Nevada, Reno competes in Division I baseball as a member of the Mountain West Conference. It is an experienced group, with 13 of 35 players seniors or graduate students. Its biggest source of players is California, at 32%, ahead of Nevada, where the school sits.

NCAA Division IMountain West ConferenceNevada
Head coach
Jordan Getzelman

Head Coach

Home venue
Don Weir Field at Peccole Park
Average roster
38

players a season

Five-year win rate
49%

Fit check

Do You Fit at University of Nevada, Reno?

Pick your position and level, add a test score if you have one, and get an instant read on your chances here. Free, and no account needed.

Coaching staff

Get on This Staff's Radar

Roster

Roster Breakdown

The roster by class

9FreshmenFr.
9SophomoresSo.
4JuniorsJr.
9SeniorsSr.
4GraduateGrad

35 players on the latest roster (2026).

Just 20% of last year's freshmen, sophomores and juniors are back on the roster, below the 61% median among Division I baseball teams. Upperclass depth is the story here, as 13 of 35 players are seniors or graduate students.

Positions

Baseball Roster by Position

How many players a season the program carries at each position, and how tall they are.

Pitcher
18.7players a season

Average height 6'2"

Catcher
3players a season

Average height 6'2"

Infielder
8.7players a season

Average height 6'0"

Outfielder
6players a season

Average height 6'1"

Utility/Designated Hitter
1.7players a season

Average height 6'0"

Footprint

Where This Team Recruits

Where the players are from

113players
In-state30.1%
Other US states67.3%
International2.7%

Counted from players on recent rosters with a known hometown.

Top home states

California32%
Nevada30%
Hawaii8%
Arizona7%
Idaho4%

On this roster, California outweighs Nevada: 32% of players compared with 30% for Nevada. The newest class leans on California, which supplies five of nine freshmen.

Results

University of Nevada, Reno Baseball Recent Results

2022

53%

29-26overall

18-12conference

2023

38%

20-33overall

10-20conference

2024

49%

25-26overall

16-14conference

Best season

2025

60%

34-23overall

19-11conference

Latest

2026

47%

24-27overall

13-11conference

Results have stayed close to .500, with a 49% winning percentage over five seasons and single-season rates between 38% and 60%.

Standings

Mountain West Conference Standings

Where University of Nevada, Reno stands in the Mountain West Conference.

Schedule and travel

Baseball Schedule

The season's games, home and away, and how far the team travels.

Recruiting

Recruiting Outlook

Nevada is a competitive NCAA Division I program in the Mountain West. The Wolf Pack won the conference regular-season title in 2025 and continued to produce multiple all-conference selections in 2026, so recruits should expect a high level of competition for roster opportunities.

Mountain West regular-season champion in 2025Multiple all-conference selections in 2026Division I roster with junior college and four-year transfer experience

Recruiting difficulty

80/ 100Hard
OpenCompetitiveSelectiveElite

Nevada is a strong Division I program where most roster opportunities are likely to favor recruited players with proven performance and positional fit.

What coaches value

  • Reliable tools at a specific position, including defensive consistency and game-ready athleticism
  • Pitchers who command the strike zone, compete in counts, and show repeatable mechanics
  • Offensive approach, quality at-bats, and the ability to contribute beyond raw power
  • Coachability, physical development, and versatility across positions or roles

How to get recruited here

Build a verified baseball profile with current measurements, academic information, video, and meaningful game statistics. Send coaches concise updates that show your fit for a specific position, then attend competitive events where Division I staff can evaluate your tools, athleticism, and consistency.

How hard is it to make the team

Making Nevada's baseball team is difficult because it is a competitive Division I program competing in the Mountain West. A recruit should generally show college-ready tools and performance, while players pursuing a developmental path need a clear strength, strong academic preparation, and evidence of growth.

Who fits this program

  • Baseball players seeking highly competitive Division I competition may fit.
  • Students should balance baseball commitments with public research university academics.
  • A large urban residential campus offers an active city setting.
  • Players prepared to compete for roster opportunities alongside transfers may fit.

Program stats

The Program by the Numbers

39

Athletes on the roster

3

Coaches on staff

$20,723

Spent per athlete

Spending and revenue a year

Spending$2,181,975
Revenue$2,233,423

Revenue covers everything the program spends.

According to the 2025 EADA report, 39 athletes share three coaches, roughly 13 athletes per coach and above the median of 10 among Division I baseball teams. Operating spending comes to around $22,000 per athlete in the same report, about twice the Division I median.

Source: the federal Equity in Athletics report, 2025.

Feeders

Top Feeder Schools and Clubs

The high schools and clubs that sent the most players to this roster.

1Bishop Manogue HS5 players on recent rosters
2Reno High School3 players on recent rosters
3Bishop Gorman High School2 players on recent rosters
4Centennial High2 players on recent rosters
5Damonte Ranch High School2 players on recent rosters

The staff has drawn five players from Bishop Manogue High School in recent seasons, and counts five sources that have each sent two or more players.

The school

School Environment

University of Nevada, Reno combines engineering, business and health-related strengths with a research environment, making academic preparation, course demands and career direction important considerations alongside your athletic goals.

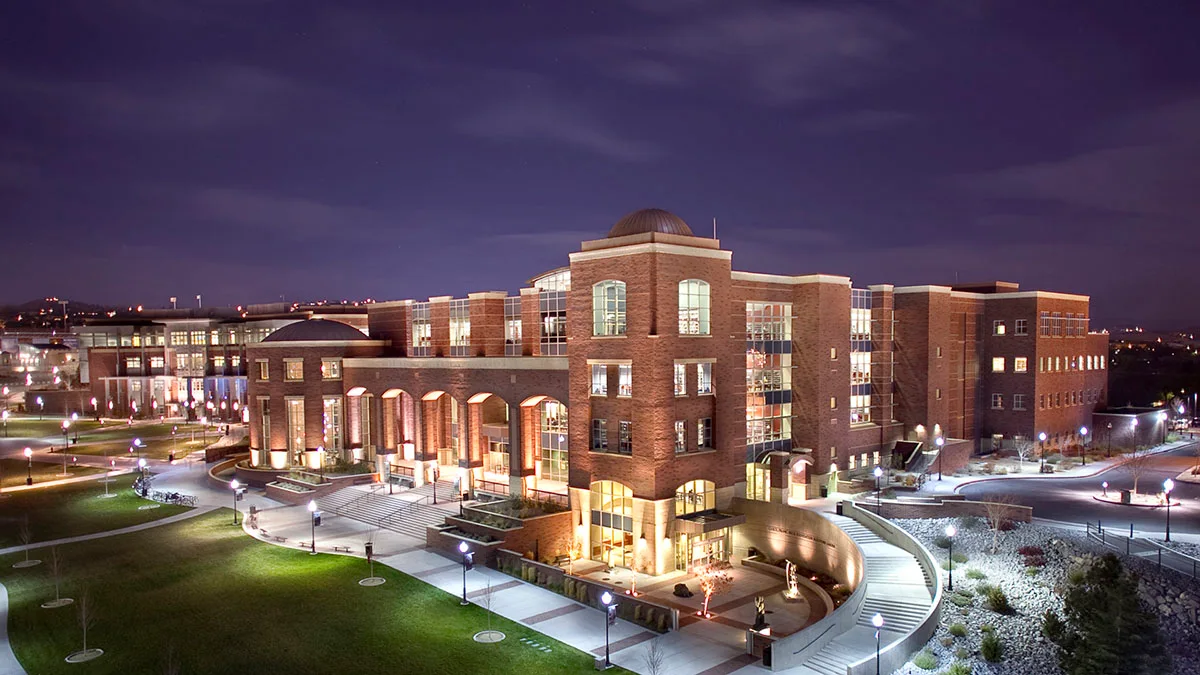
University of Nevada, Reno campusUniversity of Nevada, RenoReno, NevadaSee the full profile
74%

Acceptance rate

61%

Graduation rate

Undergraduates
19,117
Net price a year
$15,927
Earnings after ten years
$60,614

Camps

University of Nevada, Reno Baseball Camps

New camp dates are not posted yet. These ran last season.

Dec12025
Skills campBaseball · Men's

Offseason Winter Throwing Clinics

  • Dec 1 to Jan 28, 2026
  • Don Weir Field at Peccole Park, Reno, NV

Offseason winter throwing clinics for Wolf Pack baseball held at Don Weir Field at Peccole Park on the University of Nevada campus.
See every University of Nevada, Reno camp

Similar programs

Similar Baseball Teams

Programs at a similar level, with similar academics, worth adding to your recruiting list.

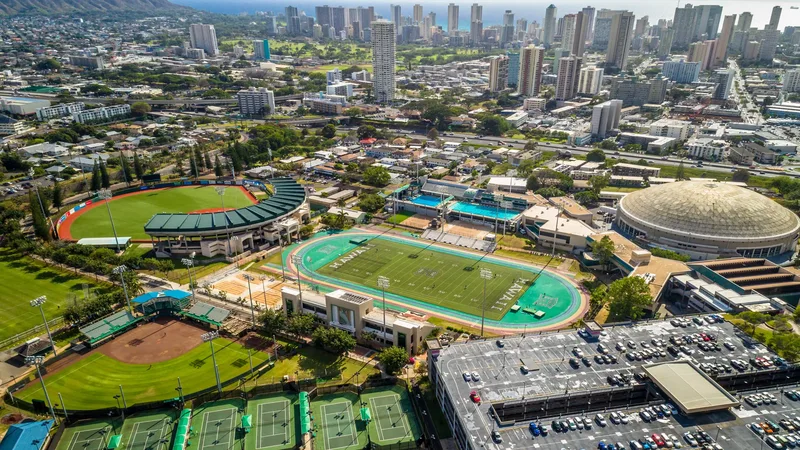
University of Hawaii at Manoa

Honolulu, HI

Why it is similar: Same conference.
Mountain West Conference60% 5-year win rate

Research opportunities, Division I competition and Honolulu's cultural setting give athletes distinct reasons to pursue a place here.

View team

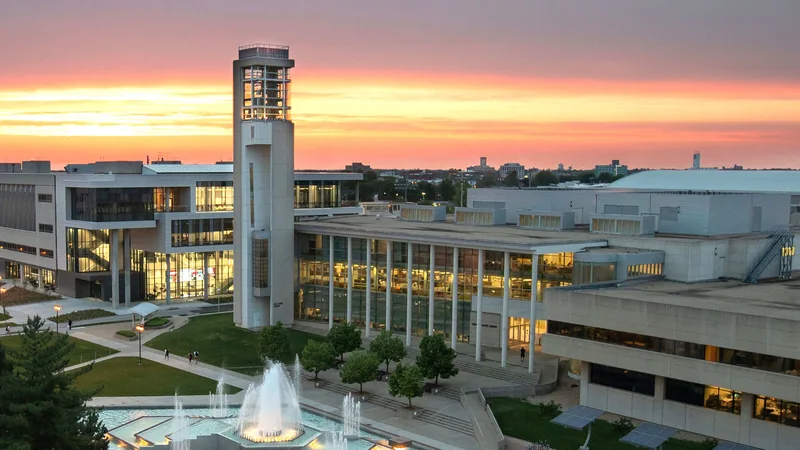
Missouri State University

Springfield, MO

Why it is similar: Similar level and academics.
Conference USA51% 5-year win rate

Competitive athletics, broad academic options and relatively affordable tuition give recruits several reasons to consider this campus.

View team

Teams in Nevada

More Baseball Teams in Nevada

Mountain West Conference53% 5-year win rate

Hospitality strengths, Las Vegas internship access and Mountain West competition give athletes practical reasons to consider this campus.

View team

Roster openings

Which D1 Baseball programs have the most roster spots opening up?

Every program ranked by players in their final year, with the positions they are losing.

10.2players leaving per program, on average
See the programs

Three ways to start

Where are you in the search?

Pick the option that matches where you are, and we will show you the plan that fits.

Recruiting Plan

Your 20 to 25 best-fit schools, picked for you.

  • Starter: the list, fit reads, real costs and a dated timeline
  • Complete: adds roster reads and coach emails for every school
$99 or $249Starter or Complete, one time
Build my plan
Roster Report

The roster at your position, at the schools you pick.

  • Who is graduating at your position, class year by class year
  • Where spots are likely to open, in plain words
From $193, 8 or 15 schools
Choose my schools
School Plan

One school, covered end to end.

  • Your honest odds, the roster and the verified coach
  • Intro email, three follow-ups, admissions steps and timeline
$49One school, one time
Pick my school

Resources

Additional Resources

Pathley Chat