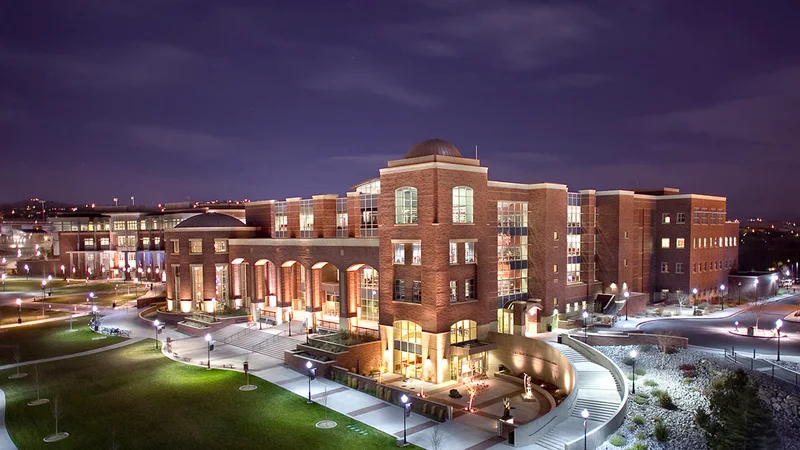

Mountain West competition, engineering strengths and access to Lake Tahoe give athletes distinct reasons to consider Nevada.

NCAA Division IMountain West ConferenceNevada

University of Nevada, Las Vegas Men's Basketball
One plan built for University of Nevada, Las Vegas Men's Basketball, with the roster read, the coach's contact and a dated plan, delivered within 24 hours. An expert checks every plan.
- 14
- Roster
- 4
- Leaving
- 24%
- In-state
- 57%
- Transfers
Overview
University of Nevada, Las Vegas Men's Basketball Team Details
Key facts about the University of Nevada, Las Vegas men's basketball team.
In Las Vegas, Nevada, University of Nevada, Las Vegas competes in Division I men's basketball through the Mountain West Conference. Winning is a habit, with five straight seasons above .500. Even so, only 27% of last season's non-seniors returned, which marks high turnover among Division I men's basketball teams.
NCAA Division IMountain West ConferenceNevada
- Head coach
- Josh Pastner
- Home venue
- Henderson, Nevada
- Average roster
- 15
- Five-year win rate
- 57%
Head Coach
players a season
Fit check
Do You Fit at University of Nevada, Las Vegas?
Pick your position and level, add a test score if you have one, and get an instant read on your chances here. Free, and no account needed.
Coaching staff
Get on This Staff's Radar
Head coach
Josh PastnerHead CoachEmail●●●●●●@●●●●.edu
Phone(●●●) ●●●-●●●●
Roster
Roster Breakdown
The roster by class
2FreshmenFr.
3SophomoresSo.
5JuniorsJr.
3SeniorsSr.
1GraduateGrad
14 players on the latest roster (2026-27).
Roster openings after 2026-27
4players in their final year, 29% of the roster
Guard 2 · Forward 1 · Center 1
Position by position, guards lead the departures, with two leaving after the 2026-27 season. A recruit at that position would arrive just as the roster turns over.
See who you would be replacingRoster churn is a theme here, with 27% of last season's freshmen, sophomores and juniors returning against a 50% median among Division I men's basketball teams. Transfers in matter here, with seven players on the current roster arriving from another college.
Positions
Men's Basketball Roster by Position
How many players a season the program carries at each position, and how tall they are.
Guard
8.3players a season
Average height 6'3"
Forward
5.7players a season
Average height 6'9"
Center
0.7players a season
Average height 7'0"
Transfers
Transfers In and Out
8
transfers in for 2026-27
4
transfers out
- Share of the roster
- 57%
- Per 100 freshmen
- 400
- By position
- Guard 4 · Forward 2 · Center 1
- Came from
- 8 from Division I
Footprint
Where This Team Recruits
Where the players are from
45players
In-state24.4%
Other US states62.2%
International13.3%
Counted from players on recent rosters with a known hometown.
Top home states
Nevada24%
California18%
Illinois9%
Texas4%
New Jersey4%
Results
University of Nevada, Las Vegas Men's Basketball Recent Results
Swipe to see every season
2021-22
56%18-14overall
10-8conference
2022-23
59%19-13overall
7-11conference
Best season
2023-24
62%21-13overall
12-6conference
2024-25
55%18-15overall
11-9conference
Latest
2025-26
51%18-17overall
11-9conference
Consistency shows in the results: five winning seasons in a row, a 57% winning percentage. Win rate fell to 51% in the 2025-26 season, an 18-17 finish and the lowest of the last five seasons.
Standings
Mountain West Conference Standings
Where University of Nevada, Las Vegas stands in the Mountain West Conference.
Schedule and travel
Men's Basketball Schedule
The season's games, home and away, and how far the team travels.
Recruiting
Recruiting Outlook
UNLV is an NCAA Division I program in the Mountain West with a strong basketball tradition, including a national championship and multiple NCAA Tournament appearances. The current roster reflects a mix of transfers, junior college experience, international players and local prospects, making this a competitive but not clearly elite national-level opportunity at present.
Mountain West Division I competitionRoster built through transfers and regional recruitingHistoric NCAA Tournament and national championship pedigree
Recruiting difficulty
60/ 100Hard
OpenCompetitiveSelectiveElite
Making the roster typically requires recruited-level athletic ability, positional value and readiness to contribute in a competitive Division I conference.
What coaches value
- Position-specific skill, decision-making and the ability to play efficiently against physical Division I competition
- Defensive versatility, on-ball toughness and consistent effort away from the ball
- Shooting range and floor spacing for guards and wings, plus rebounding and rim protection from frontcourt players
- Maturity, coachability and evidence of performing well in high-level club, prep, junior college or college games
How to get recruited here
Build verified film that shows your best position-specific skills, defensive work and decision-making against strong competition. Send a concise recruiting profile with height, position, academic information, schedule, contact details and full-game film, then use trusted club, prep or junior college contacts to help create legitimate introductions.
How hard is it to make the team
UNLV is a competitive Division I Mountain West program, so most roster opportunities are aimed at athletes who have already demonstrated college-level ability. Walk-on or developmental paths may exist, but athletes should realistically expect competition from established transfers, junior college players, international prospects and highly recruited high school players.
Who fits this program
- Basketball players seeking competitive NCAA Division I opportunities in the Mountain West
- Players prepared to balance Division I basketball with consistent academic responsibilities
- A large urban campus suits athletes comfortable with Las Vegas city life
- Athletes with transfer, junior-college, international, or local backgrounds may fit
Program stats
The Program by the Numbers
16
Athletes on the roster
6
Coaches on staff
$43,474
Spent per athlete
Spending and revenue a year
Spending$5,338,081
Revenue$10,002,990
Revenue covers everything the program spends.
According to the 2025 EADA report, the program reports around $10 million in revenue against $5.3 million in expenses, with revenue running 87% above spending.
Source: the federal Equity in Athletics report, 2025.
Feeders
Top Feeder Schools and Clubs
The high schools and clubs that sent the most players to this roster.
1Bishop Gorman High School2 players on recent rosters2Coronado HS2 players on recent rosters3Liberty HS2 players on recent rosters
At least two players apiece have come from three schools or clubs, Bishop Gorman High School among them.
The school
School Environment
University of Nevada, Las Vegas pairs hospitality and business strengths with research across entertainment and health sciences, giving recruits practical context for evaluating coursework, admissions, faculty access and career outcomes.
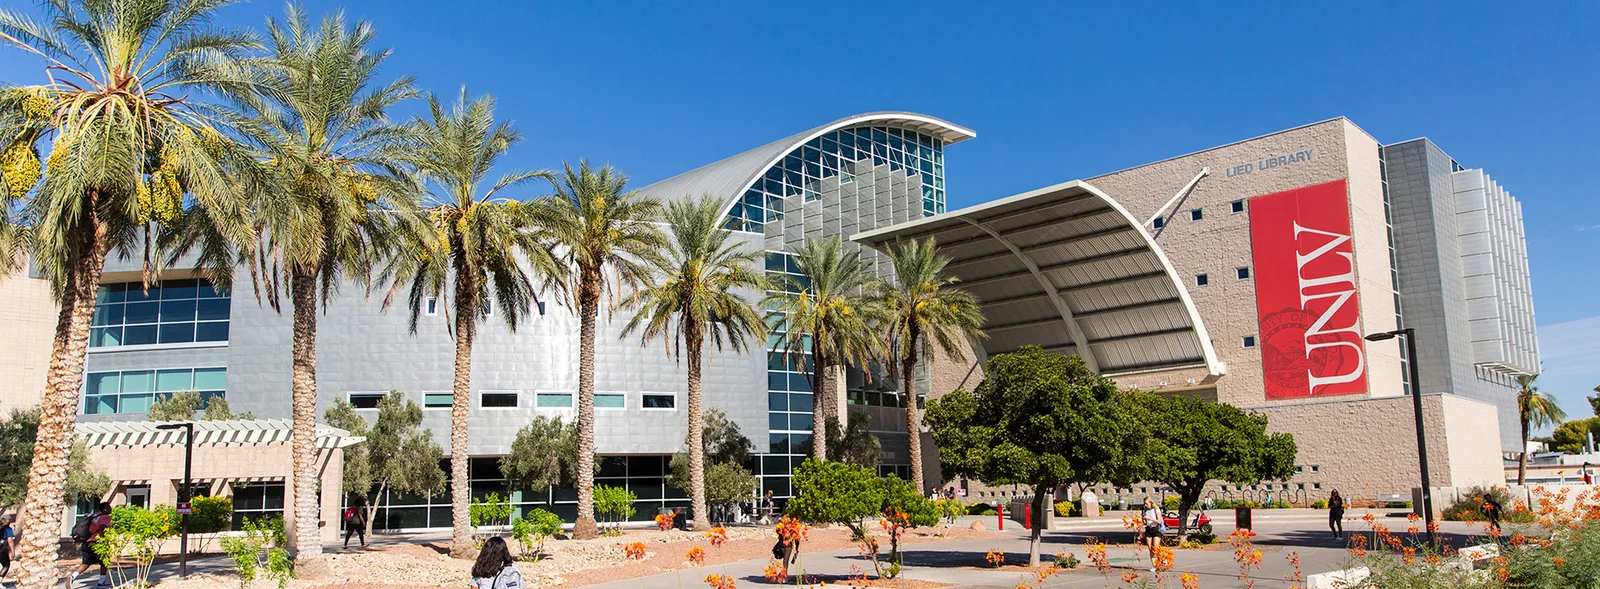 University of Nevada, Las VegasLas Vegas, NevadaSee the full profile
96%
Acceptance rate
51%
Graduation rate
- Undergraduates
- 27,132
- Net price a year
- $10,359
- Earnings after ten years
- $55,037
Official links
Official University of Nevada, Las Vegas Men's Basketball Links
Similar programs
Similar Basketball Teams
Programs at a similar level, with similar academics, worth adding to your recruiting list.


Accessible admissions, career-focused degrees and an active Phoenix campus give recruits several reasons to consider competing here.


Competitive athletics, applied academics and relatively affordable tuition give recruits practical reasons to consider studying here.
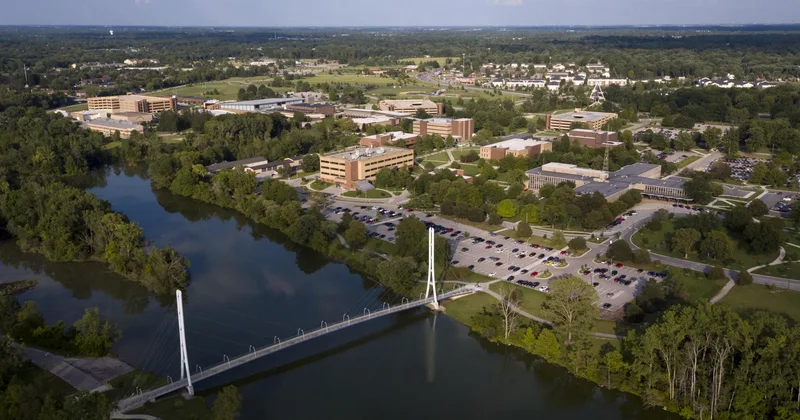

Purdue system academics, approachable faculty and regional career connections complement the demands of Division I competition.
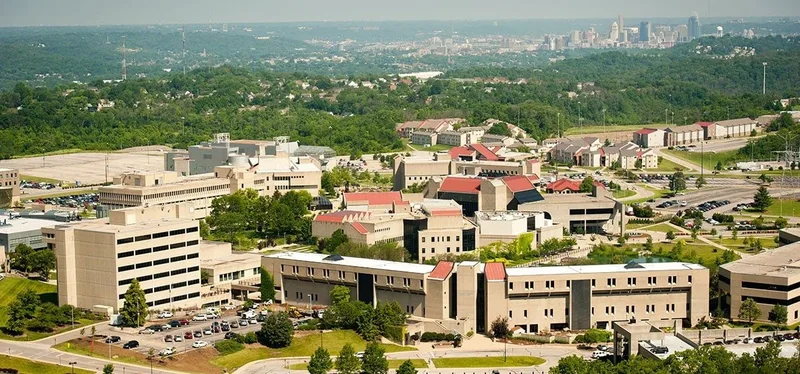

Division I competition, affordable costs and nearby Cincinnati opportunities make this a practical option for recruits.


Texas A&M University–Corpus Christi
Corpus Christi, TX
Why it is similar: Similar level and academics.Coastal academics, Southland competition and in-state value give athletes distinct reasons to consider this island campus.
Teams in Nevada
More Basketball Teams in Nevada
University of Nevada, Reno
Reno, NV
Mountain West competition, engineering strengths and access to Lake Tahoe give athletes distinct reasons to consider Nevada.
Roster openings · 2026-27
Which D1 Men's Basketball programs have the most roster spots opening up?
Every program ranked by players in their final year, with the positions they are losing.
4.3players leaving per program, on average
See the programs Three ways to start
Where are you in the search?
Pick the option that matches where you are, and we will show you the plan that fits.
Recruiting Plan
Your 20 to 25 best-fit schools, picked for you.



- Starter: the list, fit reads, real costs and a dated timeline
- Complete: adds roster reads and coach emails for every school
$99 or $249Starter or Complete, one time
Build my plan
Roster Report
The roster at your position, at the schools you pick.


- Who is graduating at your position, class year by class year
- Where spots are likely to open, in plain words
From $193, 8 or 15 schools
Choose my schools
School Plan
One school, covered end to end.
- Your honest odds, the roster and the verified coach
- Intro email, three follow-ups, admissions steps and timeline
$49One school, one time
Pick my school Resources
Additional Resources
Pathley Basketball hubRankings, divisions and programsBasketball recruiting timelineWhat to do each year of high schoolHow coaches evaluate college basketballWhat coaches look for at this levelThe basketball recruiting guideContact rules, emails and costsEvery D1 Men's Basketball programThe full list, with filters