Recruiting campBaseball · Men's
Winter Prospect Clinic
- Jan 17, 2026
- The College at Brockport, Brockport, NY
- $80
One-day prospect clinic for high-school players (9th–12th grade) featuring instruction and evaluation from Brockport baseball staff.
Browse programs
College directoryEvery program, filtered by what fits Sport directoryMen's and women's, every division State directoryPrograms in the states you would play inGo deeper
Major directoryYour major and your sport in one list Camp directoryID camps and showcases at college programs Conference directoryEvery conference and its member colleges

One plan built for SUNY Brockport Baseball, with the roster read, the coach's contact and a dated plan, delivered within 24 hours. An expert checks every plan.
Overview
Key facts about the SUNY Brockport baseball team.
In Brockport, New York, SUNY Brockport competes in Division III baseball through the Empire 8. Five straight winning seasons run through 2026. It draws 97% of its players from New York, a high in-state share among Division III baseball teams.
players a season
Fit check
Pick your position and level, add a test score if you have one, and get an instant read on your chances here. Free, and no account needed.
Coaching staff
Head coach
Xxxxxx XxxxxxxxxHead CoachThe head coach's name comes with the coach's contact.Roster
The roster by class
45 players on the latest roster (2026).
Roster spots are spread across 49 players, compared with a median of 40 among Division III baseball teams. A bigger roster tends to mean more competition for a lineup spot.
Positions
How many players a season the program carries at each position, and how tall they are.
Average height 6'0"
Average height 5'11"
Average height 5'11"
Average height 6'0"
Among Division III baseball teams, few teams lean harder on infielders, which fill 29% of the roster compared with an average of 20%.
Footprint
Where the players are from
Counted from players on recent rosters with a known hometown.
Top home states
Players from New York fill 97% of the roster, which makes this one of the more local programs among Division III baseball teams.
Results
Swipe to see every season
2022
75%33-11overall
13-5conference
2023
62%29-18overall
14-4conference
2024
58%22-16overall
9-9conference
2025
86%36-5-2overall
21-1-1conference
2026
51%22-21overall
17-5conference
This team slipped from 36-5-2 in 2025 to 22-21 in 2026, but has put together five straight winning seasons. By contrast, this team went 17-5 in Empire 8 play and 22-21 overall in 2026.
Standings
Where SUNY Brockport stands in the Empire 8.
Schedule and travel
The season's games, home and away, and how far the team travels.
Recruiting
Who fits this program
Program stats
Athletes on the roster
Coaches on staff
Spent per athlete
Spending and revenue a year
Revenue covers everything the program spends.
The ratio is roughly 17 athletes per coach in the 2025 EADA report, above the median of 11 among Division III baseball teams.
Source: the federal Equity in Athletics report, 2025.
Feeders
The high schools and clubs that sent the most players to this roster.
On recent rosters, five players came from Arlington High School, more than from any other school or club, ahead of Orchard Park High School with four. On recent rosters, five schools or clubs show up with two or more players each.
The school
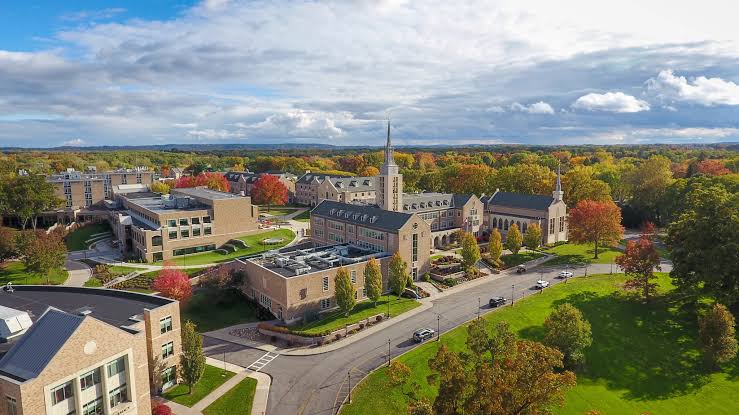
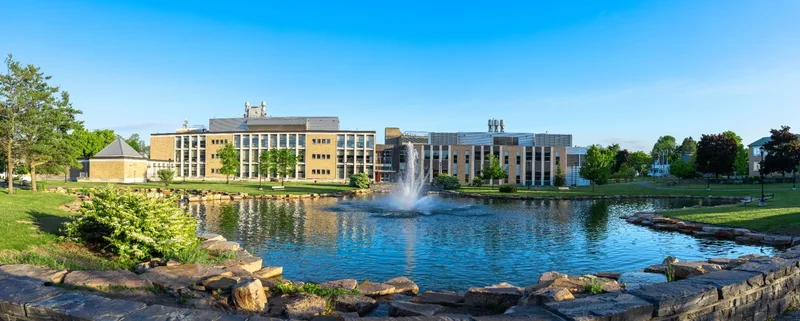
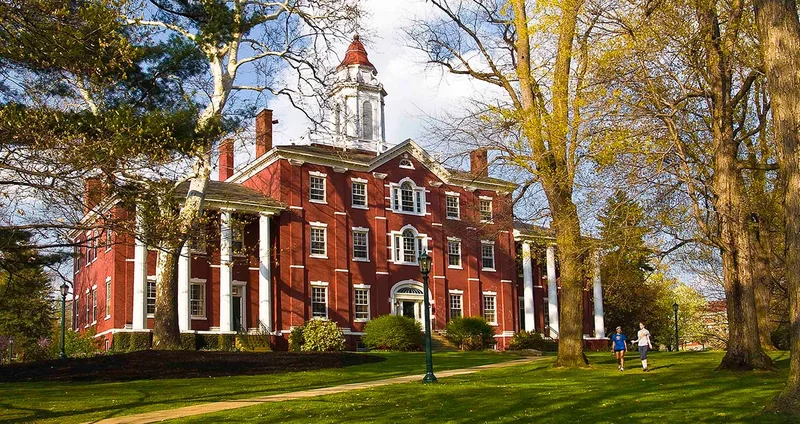
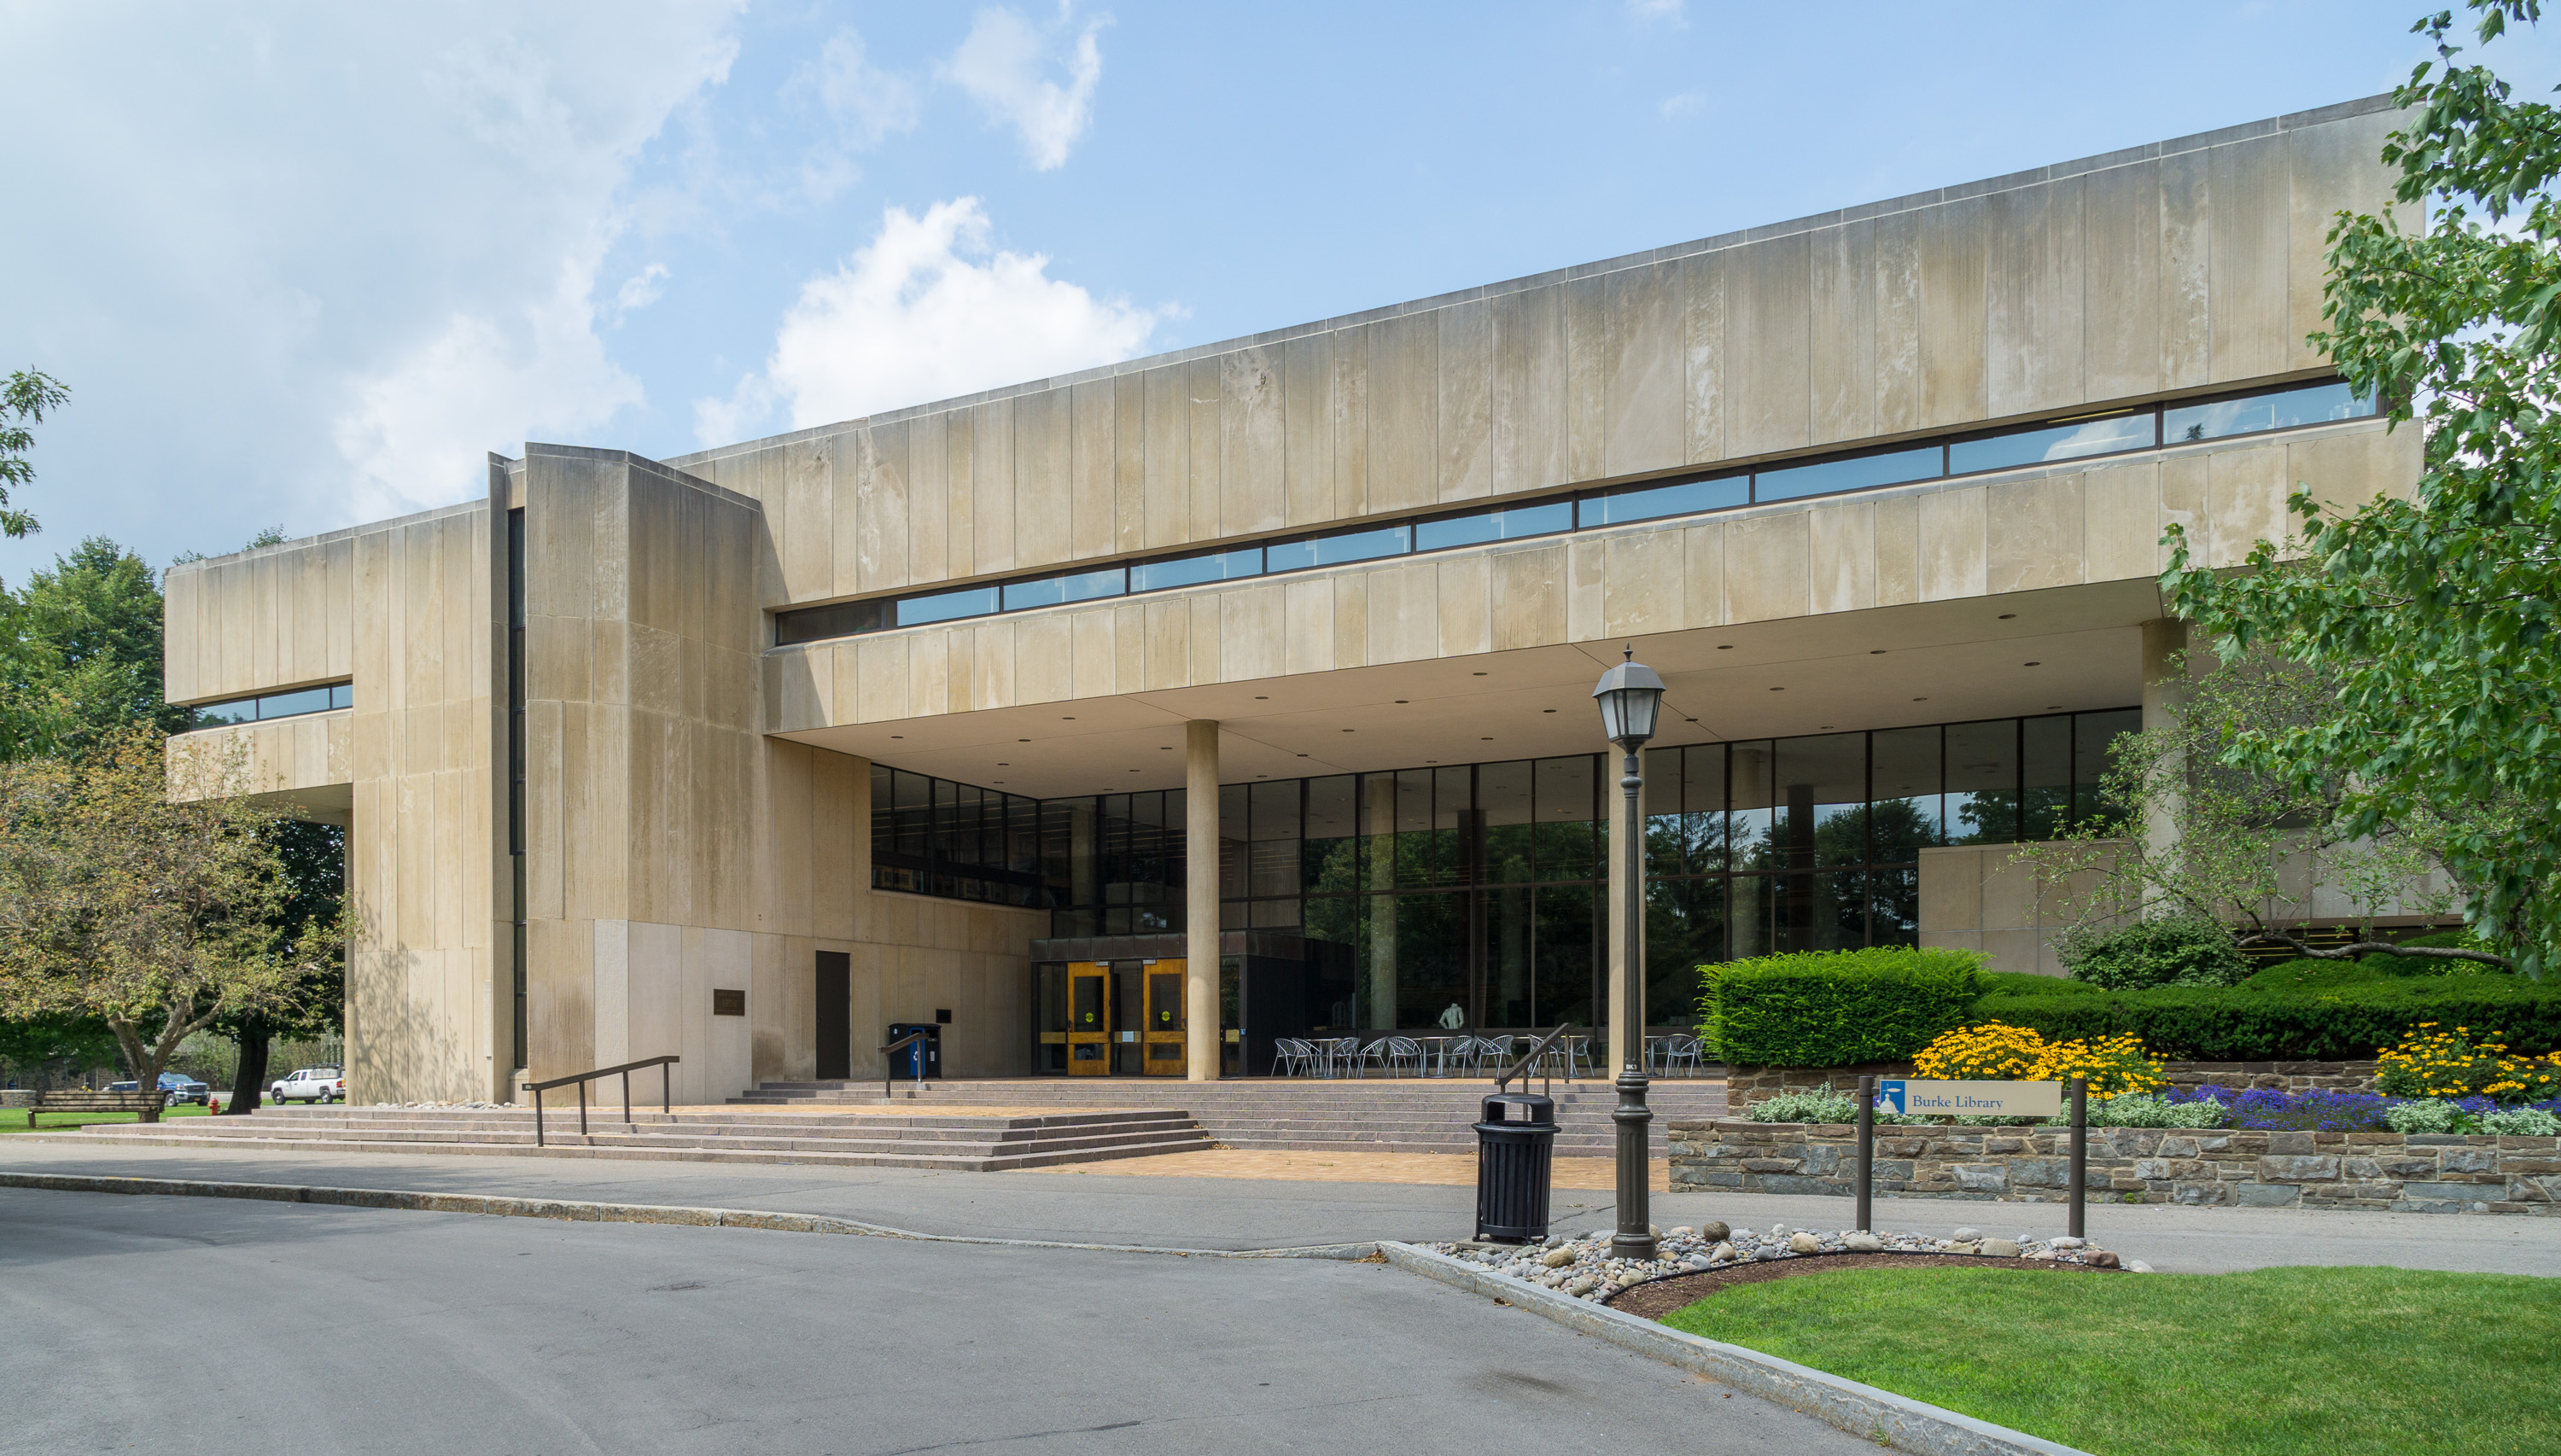
SUNY Brockport's teacher education roots and applied learning opportunities shape an academic experience worth comparing through coursework demands, popular majors, faculty access, graduation progress and longer-term career outcomes.
SUNY BrockportBrockport, New YorkSee the full profile Acceptance rate
Graduation rate
Camps
New camp dates are not posted yet. These ran last season.
One-day prospect clinic for high-school players (9th–12th grade) featuring instruction and evaluation from Brockport baseball staff.
Official links
Similar programs
Programs at a similar level, with similar academics, worth adding to your recruiting list.
Career-focused programs, a close-knit campus and competitive athletics appeal to students who want balance without easy coursework.
Utica, NY
Why it is similar: Same conference and state.A small campus and career-focused academics appeal to athletes who want technical preparation alongside competitive athletics.
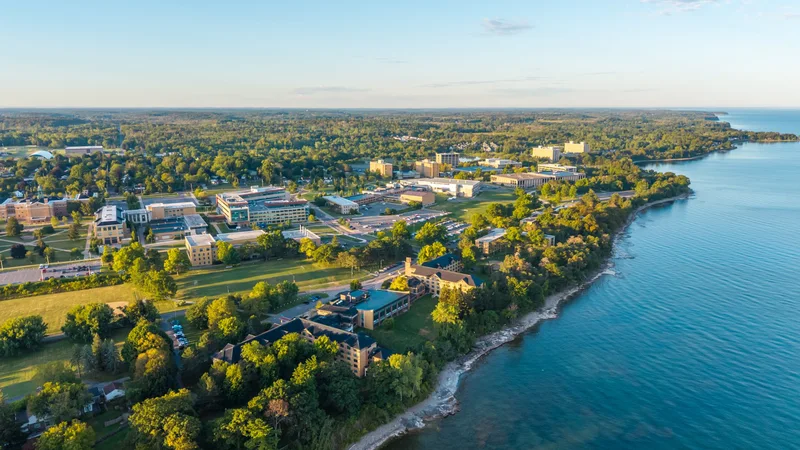
Lakeside campus life, accredited academic options and public tuition appeal to athletes pursuing Division III competition.
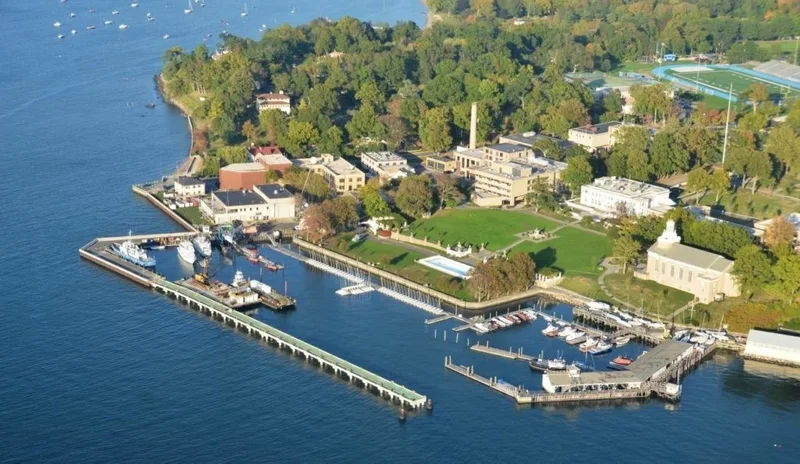
Maritime career preparation, close faculty access and competitive athletics appeal to recruits who welcome a structured academy lifestyle.
Maritime career preparation, waterfront training and Division III competition give athletes a focused college experience.
Athletes choose this small campus for competitive athletics, accessible admissions, public tuition value and nearby outdoor recreation.
Teams in New York
Alfred, NY
Hands-on academics, SUNY affordability and a small residential community give athletes practical reasons to pursue this campus.
Alfred, NY
Small classes, hands-on academics and Division III competition appeal to athletes seeking a close-knit residential college experience.
Annandale-on-Hudson, NY
Athletes choose a setting where challenging liberal arts study, close faculty relationships and competition can fit together.
Elmira, NY
Close faculty connections and a small campus help athletes build an academic identity alongside their sport.
Clinton, NY
An open curriculum, close faculty connections and competitive NESCAC athletics appeal to academically driven recruits.
Hamburg, NY
Career-focused majors, accessible admissions and a close-knit campus give athletes practical reasons to consider competing here.
Geneva, NY
Athletes come for competitive programs, close faculty relationships and a residential community with strong career preparation.
Houghton, NY
A close-knit campus, approachable faculty and Division III competition offer a connected college experience for athletes.
Ithaca, NY
Competitive athletics, hands-on academics and close mentoring appeal to recruits who want a connected college experience.
Keuka Park, NY
A close-knit lakeside community and hands-on academics appeal to athletes seeking personal connections alongside competitive athletics.
Purchase, NY
Athletes can combine competitive conference play with accessible admissions, close faculty contact and a contained residential campus.
Newburgh, NY
Close faculty connections and career-focused academics give athletes a practical foundation alongside Skyline Conference competition.
Roster openings
Every program ranked by players in their final year, with the positions they are losing.
Three ways to start
Pick the option that matches where you are, and we will show you the plan that fits.
Resources