

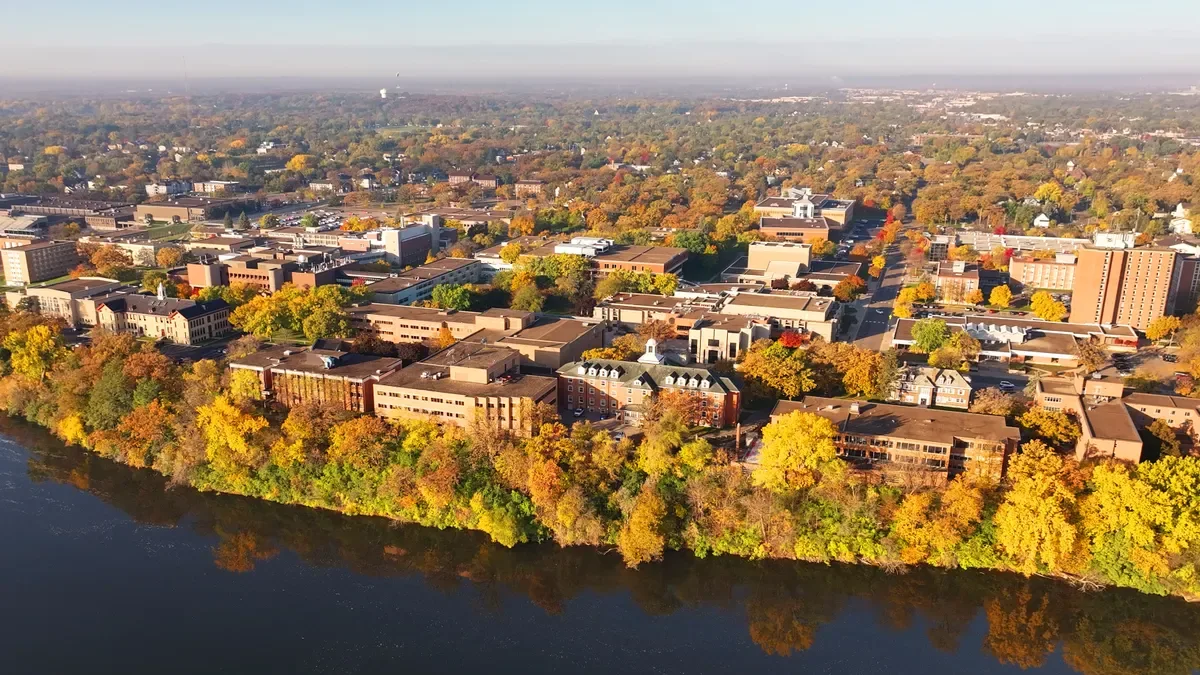
Career-focused programs, reachable faculty and a close-knit riverfront community give athletes reasons to consider competing here.
NCAA Division IINorthern Sun Intercollegiate ConferenceMinnesota

St. Cloud State University Baseball
One plan built for St. Cloud State University Baseball, with the roster read, the coach's contact and a dated plan, delivered within 24 hours. An expert checks every plan.
- 49
- Roster
- 38%
- In-state
Overview
St. Cloud State University Baseball Team Details
Key facts about the St. Cloud State University baseball team.
In St. Cloud, Minnesota, St. Cloud State University competes in Division II baseball through the Northern Sun Intercollegiate Conference. Five straight winning seasons run through 2025. In its freshman class, 73% are from Minnesota, against 37% of the full roster.
NCAA Division IINorthern Sun Intercollegiate ConferenceMinnesota
- Head coach
- Pat Dolan
- Home venue
- Joe Faber Field
- Average roster
- 49
- Five-year win rate
- 62%
Head Coach
players a season
Fit check
Do You Fit at St. Cloud State University?
Pick your position and level, add a test score if you have one, and get an instant read on your chances here. Free, and no account needed.
Coaching staff
Get on This Staff's Radar
Head coach
Pat DolanHead CoachEmail●●●●●●@●●●●.edu
Phone(●●●) ●●●-●●●●
Roster
Roster Breakdown
The roster by class
12FreshmenFr.
8SophomoresSo.
12JuniorsJr.
10SeniorsSr.
42 players on the latest roster (2026).
Roster spots are spread across 49 players, compared with a median of 41 among Division II baseball teams. Recruits should expect plenty of competition for playing time.
Positions
Baseball Roster by Position
How many players a season the program carries at each position, and how tall they are.
Pitcher
20players a season
Average height 6'1"
Catcher
4.7players a season
Average height 6'0"
Infielder
10.7players a season
Average height 6'1"
Outfielder
5.7players a season
Average height 6'1"
Among Division II baseball teams, few teams lean harder on infielders, which fill 26% of the roster against an average of 18%.
Footprint
Where This Team Recruits
Where the players are from
123players
In-state38.2%
Other US states59.3%
International2.4%
Counted from players on recent rosters with a known hometown.
Top home states
Minnesota38%
Wisconsin29%
Iowa8%
Arizona6%
Puerto Rico2%
The freshman class is more local than the roster as a whole, with 73% from Minnesota against 37% of the current roster.
Results
St. Cloud State University Baseball Recent Results
Swipe to see every season
2021
61%22-14overall
18-9conference
Best season
2022
74%37-13overall
28-5conference
2023
62%33-20overall
20-10conference
2024
63%32-19overall
28-11conference
Latest
2025
52%28-26overall
22-18conference
Five straight winning seasons, 2021 through 2025, add up to a 62% win rate. By contrast, the lowest win rate of the last five seasons, 52%, came in 2025 at 28-26.
Standings
Northern Sun Intercollegiate Conference Standings
Where St. Cloud State University stands in the Northern Sun Intercollegiate Conference.
Schedule and travel
Baseball Schedule
The season's games, home and away, and how far the team travels.
Recruiting
Recruiting Outlook
St. Cloud State baseball is a competitive NCAA Division II program in the Northern Sun Intercollegiate Conference. The roster shows a mix of freshmen, returning players, junior college transfers, and players with experience at other four-year programs, so recruits should expect competition from both developing high school players and experienced transfers.
NCAA Division II and NSIC competitionRoster includes junior college and four-year transfersPosition-specific depth across pitching and the field
Recruiting difficulty
60/ 100Hard
OpenCompetitiveSelectiveElite
The program is competitive at the Division II level, and most roster opportunities are likely to favor players with clear positional value, consistent performance, and a strong recruiting profile.
What coaches value
- Pitchers with reliable command, repeatable mechanics, and the ability to handle strong conference hitters
- Hitters who control the strike zone, show quality at-bats, and contribute consistent contact or power
- Defenders with dependable fundamentals, range, arm strength, and positional flexibility
- Competitive athletes who maintain physical development, academic progress, and dependable team habits
How to get recruited here
Create a concise recruiting profile with verified measurables, academic information, position-specific statistics, and updated video. Contact the baseball staff early, explain why St. Cloud State fits your goals, and share competition footage that shows decision-making, defensive actions, pitching command, or quality at-bats rather than highlights alone.
How hard is it to make the team
Making the team is moderately difficult because St. Cloud State competes in NCAA Division II and the NSIC, where players often arrive with strong high school backgrounds or college experience. A recruit usually needs a clear role, reliable fundamentals, and the ability to contribute against conference-level competition, while developmental opportunities may be more realistic for players who show room to improve.
Who fits this program
- Baseball players seeking a competitive program with varied roster experience
- Athletes prepared to balance baseball with university coursework and career planning
- Students preferring a medium-sized public campus in an urban setting
- Recruits comfortable competing for roles alongside junior college transfers
Program stats
The Program by the Numbers
39
Athletes on the roster
5
Coaches on staff
$5,111
Spent per athlete
Spending and revenue a year
Spending$517,754
Revenue$517,754
Revenue covers everything the program spends.
Staffing is deeper per athlete than usual, as 39 athletes share five coaches in the 2025 EADA report, roughly eight athletes per coach against a median of 13 among Division II baseball teams. Operating spending comes to about $4,400 per athlete in the same report, about 41% above the Division II median.
Source: the federal Equity in Athletics report, 2025.
Feeders
Top Feeder Schools and Clubs
The high schools and clubs that sent the most players to this roster.
1Foley Senior High2 players on recent rosters
2Ironwood Ridge High School2 players on recent rosters
3Neuqua Valley High School2 players on recent rosters4Northfield Senior High2 players on recent rosters5Paynesville Area Secondary School2 players on recent rosters
Pipelines repeat here: five schools or clubs have each placed two or more players, including Foley Senior High.
The school
School Environment
St. Cloud State University emphasizes professional preparation through business, education, science and engineering, making academic fit a matter of choosing coursework that connects your athletic schedule with longer-term career goals.
St. Cloud State UniversitySt. Cloud, MinnesotaSee the full profile 95%
Acceptance rate
40%
Graduation rate
- Undergraduates
- 8,738
- Net price a year
- $13,529
- Earnings after ten years
- $55,813
Official links
Official St. Cloud State University Baseball Links
Similar programs
Similar Baseball Teams
Programs at a similar level, with similar academics, worth adding to your recruiting list.
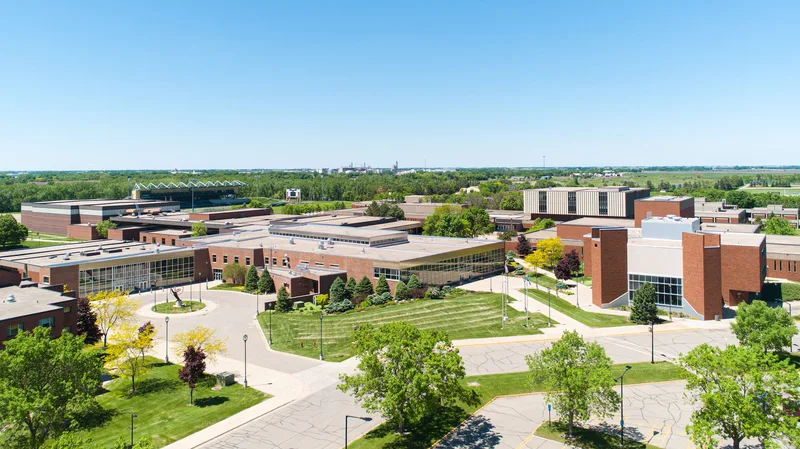

Practical academics, regional affordability and a small campus appeal to athletes seeking competitive athletics in a rural community.


A faith-centered community and Nashville opportunities give athletes ways to grow beyond their sport.
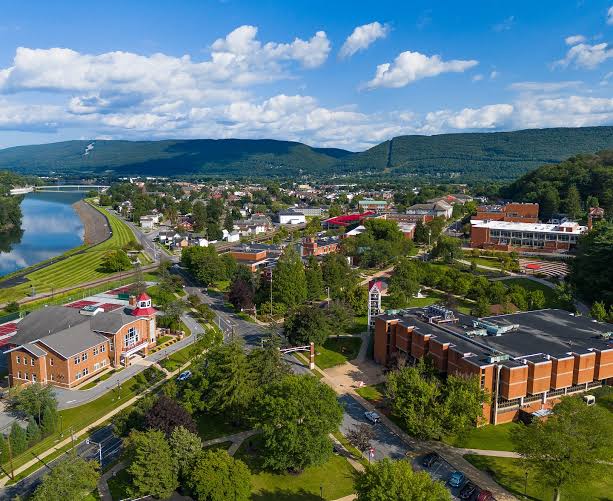

Accessible admissions, career-oriented academics and a close-knit residential setting give athletes practical reasons to consider this campus.


Competitive athletics, personal faculty access and career-focused academics draw recruits who prefer a small, rural campus.


Athletes find competitive regional play, approachable faculty and state capital opportunities within a supportive campus community.
Teams in Minnesota
More Baseball Teams in Minnesota
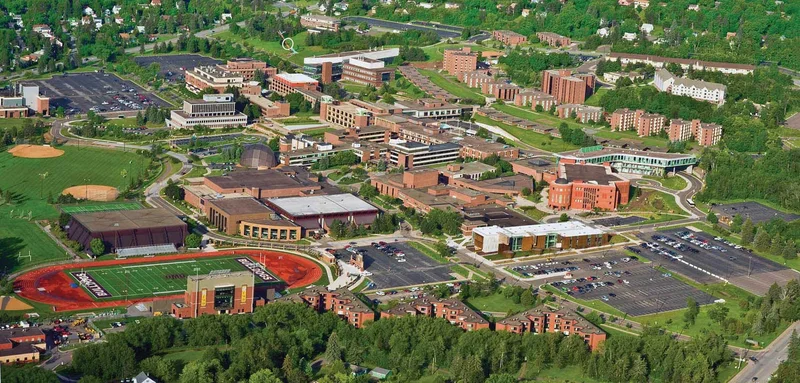

University of Minnesota Duluth
Duluth, MN
Athletes choose this campus for its engineering strengths, competitive athletics, public university value and lakeside setting.
Roster openings
Which D2 Baseball programs have the most roster spots opening up?
Every program ranked by players in their final year, with the positions they are losing.
11.6players leaving per program, on average
See the programs Three ways to start
Where are you in the search?
Pick the option that matches where you are, and we will show you the plan that fits.
Recruiting Plan
Your 20 to 25 best-fit schools, picked for you.



- Starter: the list, fit reads, real costs and a dated timeline
- Complete: adds roster reads and coach emails for every school
$99 or $249Starter or Complete, one time
Build my plan
Roster Report
The roster at your position, at the schools you pick.


- Who is graduating at your position, class year by class year
- Where spots are likely to open, in plain words
From $193, 8 or 15 schools
Choose my schools
School Plan
One school, covered end to end.
- Your honest odds, the roster and the verified coach
- Intro email, three follow-ups, admissions steps and timeline
$49One school, one time
Pick my school Resources