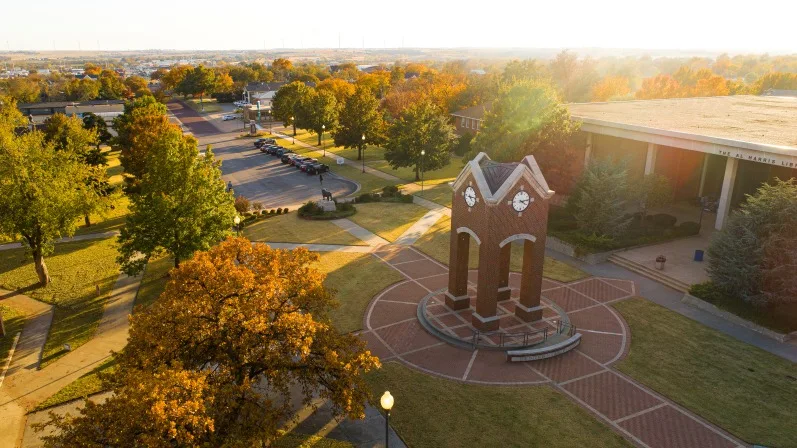

Professional programs, accessible admissions and a close-knit campus give athletes practical reasons to pursue competitive collegiate athletics here.
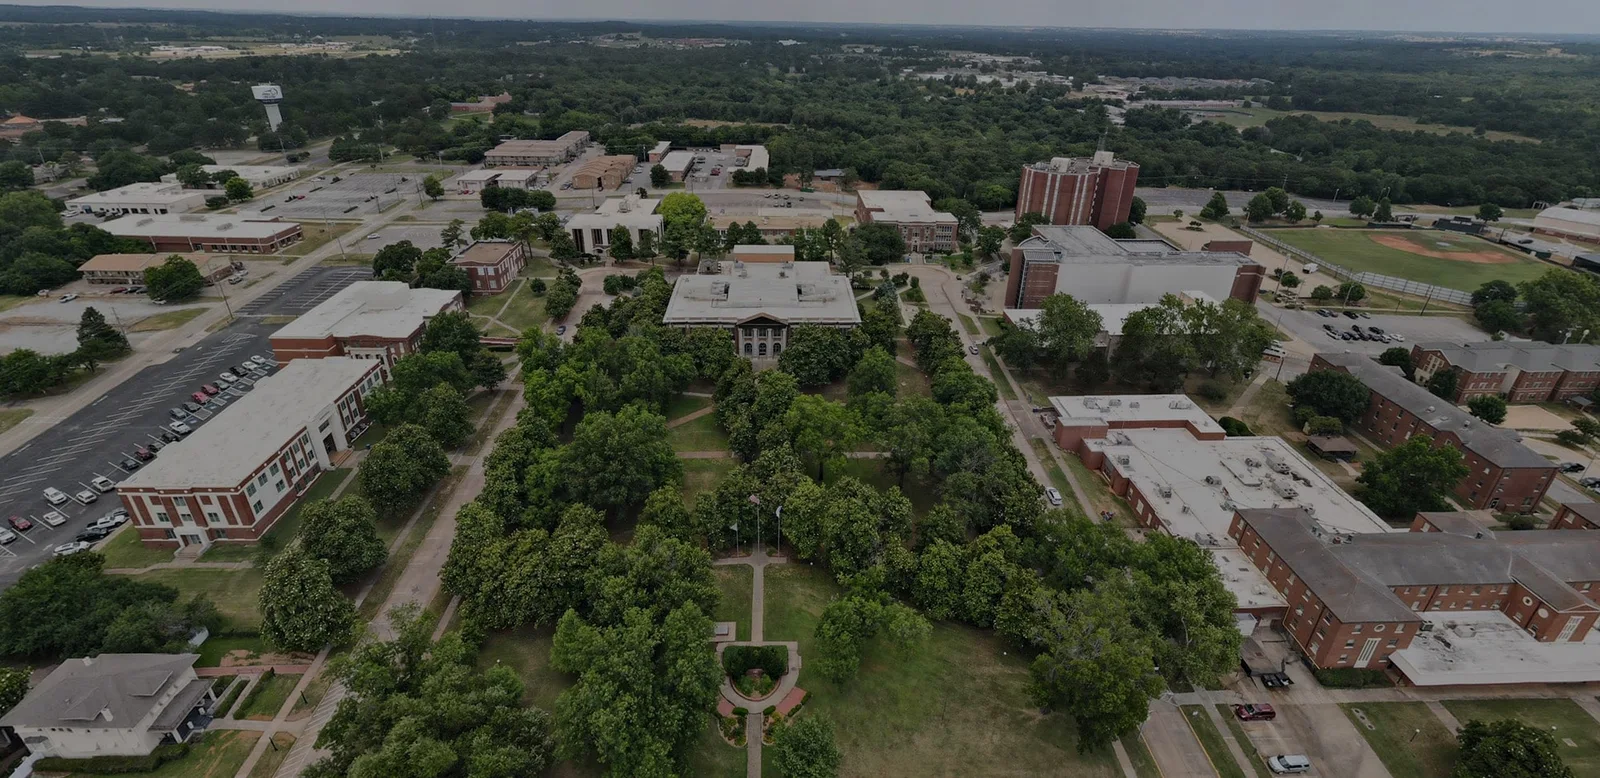
NCAA Division IIGreat American ConferenceOklahoma

Southeastern Oklahoma State University Baseball
One plan built for Southeastern Oklahoma State University Baseball, with the roster read, the coach's contact and a dated plan, delivered within 24 hours. An expert checks every plan.
- 49
- Roster
- 12
- Leaving
- 24%
- In-state
- 10%
- Transfers
Overview
Southeastern Oklahoma State University Baseball Team Details
Key facts about the Southeastern Oklahoma State University baseball team.
Based in Durant, Oklahoma, Southeastern Oklahoma State University competes in the Great American Conference at the Division II level in baseball. The most room for the Class of 2027 is among pitchers, with nine leaving after the 2026-27 season. It climbed from 22-30 in 2025 to 30-21 in 2026.
NCAA Division IIGreat American ConferenceOklahoma
- Head coach
- Alan Trayler
- Home venue
- Mike Metheny Field
- Average roster
- 45
- Five-year win rate
- 50%
Head Coach
players a season
Fit check
Do You Fit at Southeastern Oklahoma State University?
Pick your position and level, add a test score if you have one, and get an instant read on your chances here. Free, and no account needed.
Coaching staff
Get on This Staff's Radar
Head coach
Alan TraylerHead CoachEmail●●●●●●@●●●●.edu
Phone(●●●) ●●●-●●●●
Roster
Roster Breakdown
The roster by class
10FreshmenFr.
8SophomoresSo.
19JuniorsJr.
9SeniorsSr.
3GraduateGrad
49 players on the latest roster (2027).
Roster openings after 2026-27
12players in their final year, 25% of the roster
Pitcher 9 · Infielder 1 · Outfielder 1 · Utility/Designated Hitter 1
Looking at the Class of 2027, departures cluster among pitchers, with nine finishing up after the 2026-27 season. Players at that position have the clearest chance to step into new roles.
See who you would be replacingJust 60% of last year's freshmen, sophomores and juniors are back on the roster, below the 72% median among Division II baseball teams.
Positions
Baseball Roster by Position
How many players a season the program carries at each position, and how tall they are.
Pitcher
22.7players a season
Average height 6'1"
Catcher
4.7players a season
Average height 5'11"
Infielder
10.7players a season
Average height 6'0"
Outfielder
5players a season
Average height 6'0"
Utility/Designated Hitter
1.7players a season
Average height 6'2"
The outfielders group fills just 11% of the roster, about five a season, below the 17% average among Division II baseball teams.
Transfers
Transfers In and Out
5
transfers in for 2026-27
0
transfers out
- Share of the roster
- 10%
- Per 100 freshmen
- 50
- By position
- Pitcher 4 · Utility/Designated Hitter 1
- Came from
- 1 from Division I, 1 from Division II, 1 from Division III, 2 from NAIA
Footprint
Where This Team Recruits
Where the players are from
132players
In-state23.5%
Other US states75.8%
International0.8%
Counted from players on recent rosters with a known hometown.
Top home states
Texas61%
Oklahoma24%
California4%
Louisiana2%
Arkansas2%
More players come from Texas, 61% of the roster, than from Oklahoma, the home state, at 24%. Texas accounts for 60% of the current freshman class.
Results
Southeastern Oklahoma State University Baseball Recent Results
Swipe to see every season
Best season
2022
62%32-20overall
20-13conference
2023
53%28-25overall
17-16conference
2024
35%17-32overall
7-26conference
2025
42%22-30overall
16-17conference
Latest
2026
59%30-21overall
19-14conference
Winning percentage climbed from 42% in 2025 to 59% in 2026, a 17-point gain that took the record from 22-30 to 30-21.
Standings
Great American Conference Standings
Where Southeastern Oklahoma State University stands in the Great American Conference.
Schedule and travel
Baseball Schedule
The season's games, home and away, and how far the team travels.
Recruiting
Recruiting Outlook
Who fits this program
- Competes at the NCAA Division II Great American Conference level
- Balances moderate academics alongside travel and training demands
- Small-campus, rural setting supports focused baseball development
- Best for coachable baseball players valuing steady growth opportunities
Program stats
The Program by the Numbers
46
Athletes on the roster
4
Coaches on staff
$2,923
Spent per athlete
Spending and revenue a year
Spending$532,502
Revenue$532,502
Revenue covers everything the program spends.
Source: the federal Equity in Athletics report, 2025.
The school
School Environment
At Southeastern Oklahoma State University, aviation and other career-focused programs shape an academic experience worth evaluating through coursework demands, admissions expectations, faculty access and the path from enrollment to employment.
Southeastern Oklahoma State UniversityDurant, OklahomaSee the full profile 76%
Acceptance rate
32%
Graduation rate
- Undergraduates
- 3,224
- Net price a year
- $8,039
- Earnings after ten years
- $45,079
Official links
Official Southeastern Oklahoma State University Baseball Links
Similar programs
Similar Baseball Teams
Programs at a similar level, with similar academics, worth adding to your recruiting list.


A faith-centered community, scholarship opportunities and competitive athletics appeal to recruits seeking a smaller college setting.


Competitive MIAA athletics, career-focused degrees and a commuter-friendly campus give recruits several reasons to consider UCO.


Accessible admissions, professional pathways and affordable tuition give athletes practical reasons to pursue a place here.


Personal instruction, professional programs and Lone Star Conference competition give athletes several reasons to consider this campus.
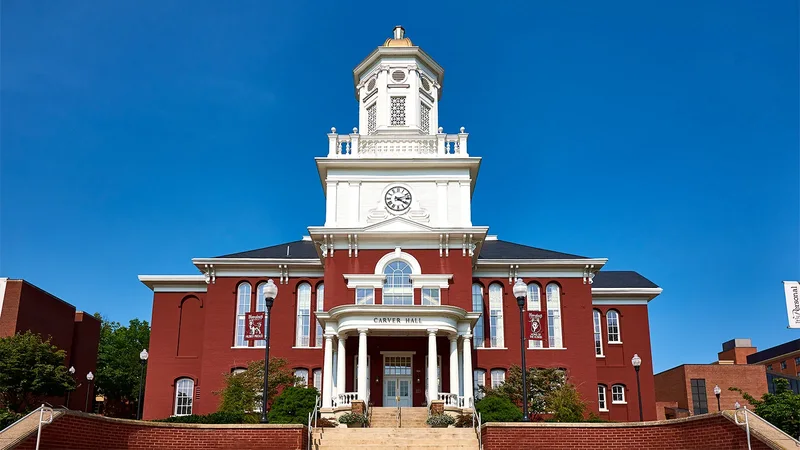

Career-focused majors, regional competition and in-state value appeal to athletes who want a residential college experience.
Teams in Oklahoma
More Baseball Teams in Oklahoma
Northeastern State University
Tahlequah, OK
Accessible admissions, professional pathways and affordable tuition give athletes practical reasons to pursue a place here.
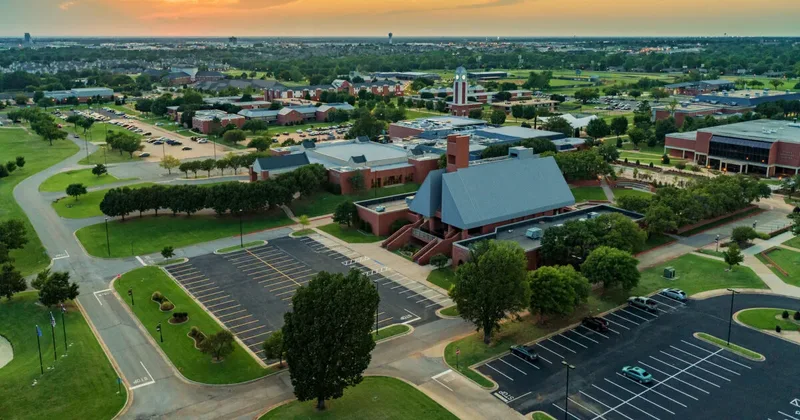

Oklahoma Christian University
Oklahoma City, OK
Athletes choose a faith-centered community, career-focused academics and Lone Star Conference competition with Oklahoma City opportunities nearby.


Rogers State University
Claremore, OK
Career-focused programs, affordable tuition and competitive athletics give recruits practical reasons to consider this small university.
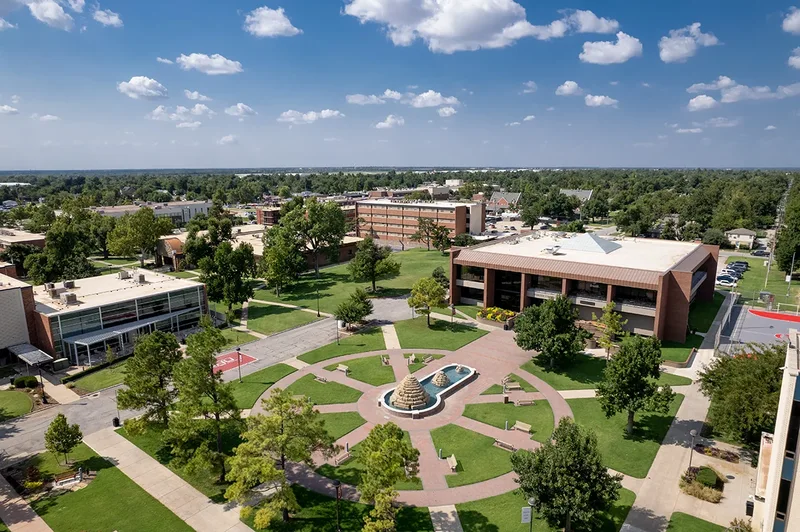

Southern Nazarene University
Bethany, OK
A small Christian community and Division II competition appeal to athletes seeking connection alongside their sport.
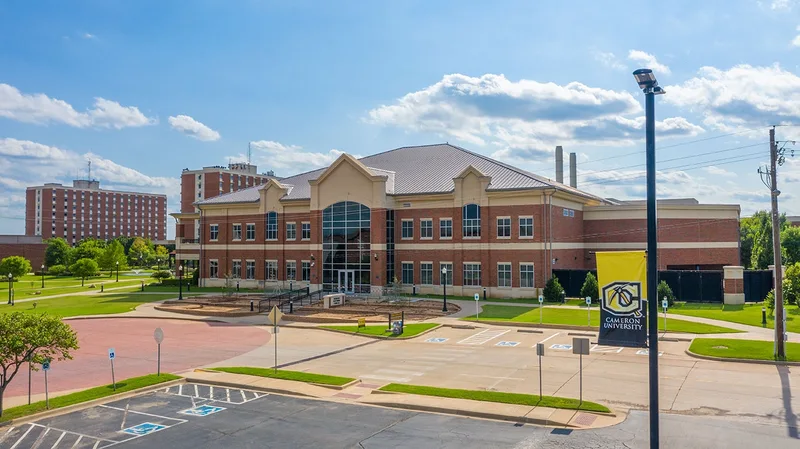

Cameron University
Lawton, OK
Affordable tuition, flexible coursework and Lone Star Conference competition give athletes practical reasons to consider Cameron.
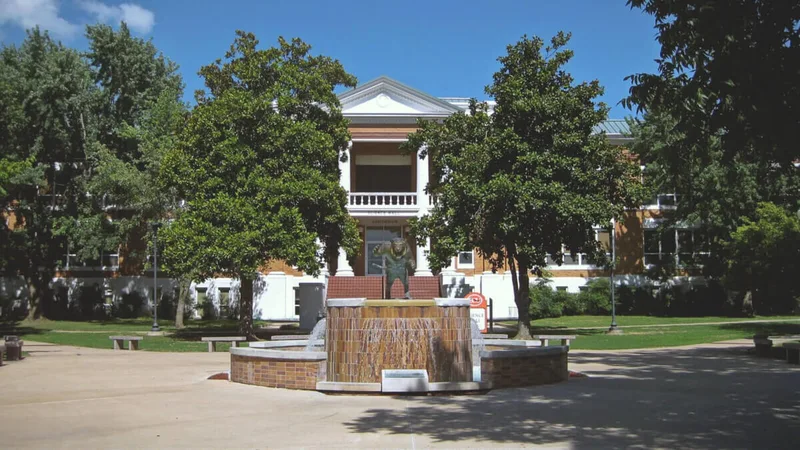

East Central University
Ada, OK
Affordable costs, career-focused academics and a close-knit campus give athletes practical reasons to consider competing here.
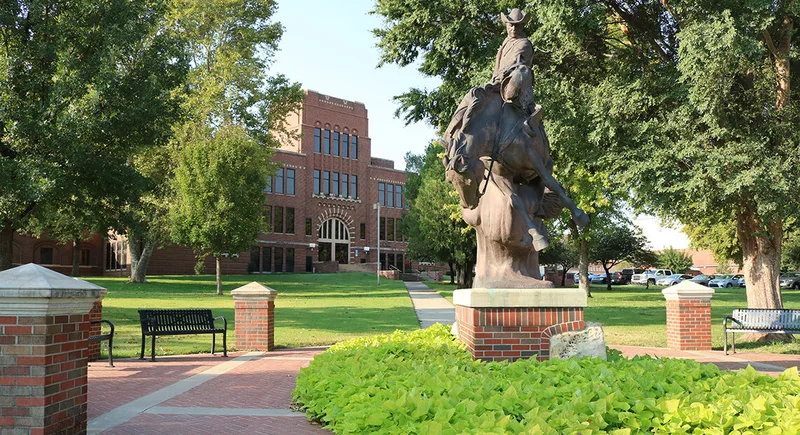

Affordable tuition, a small campus community and Division II competition give athletes practical reasons to consider enrolling.
Oklahoma Baptist University
Shawnee, OK
A faith-centered community, scholarship opportunities and competitive athletics appeal to recruits seeking a smaller college setting.
Southwestern Oklahoma State University
Weatherford, OK
Professional programs, accessible admissions and a close-knit campus give athletes practical reasons to pursue competitive collegiate athletics here.
University of Central Oklahoma
Edmond, OK
Competitive MIAA athletics, career-focused degrees and a commuter-friendly campus give recruits several reasons to consider UCO.
Roster openings · 2026-27
Which D2 Baseball programs have the most roster spots opening up?
Every program ranked by players in their final year, with the positions they are losing.
11.6players leaving per program, on average
See the programs Three ways to start
Where are you in the search?
Pick the option that matches where you are, and we will show you the plan that fits.
Recruiting Plan
Your 20 to 25 best-fit schools, picked for you.



- Starter: the list, fit reads, real costs and a dated timeline
- Complete: adds roster reads and coach emails for every school
$99 or $249Starter or Complete, one time
Build my plan
Roster Report
The roster at your position, at the schools you pick.


- Who is graduating at your position, class year by class year
- Where spots are likely to open, in plain words
From $193, 8 or 15 schools
Choose my schools
School Plan
One school, covered end to end.
- Your honest odds, the roster and the verified coach
- Intro email, three follow-ups, admissions steps and timeline
$49One school, one time
Pick my school Resources