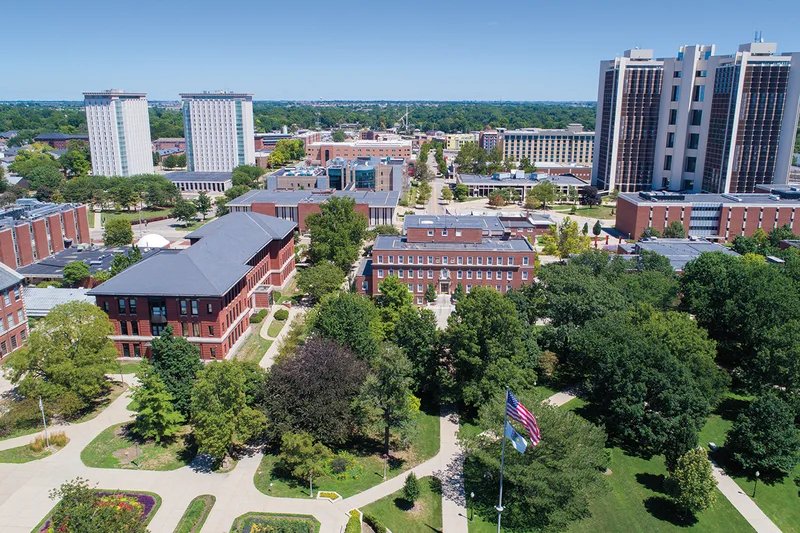

Competitive athletics, career-focused academics and regional internship opportunities give recruits several reasons to consider studying here.
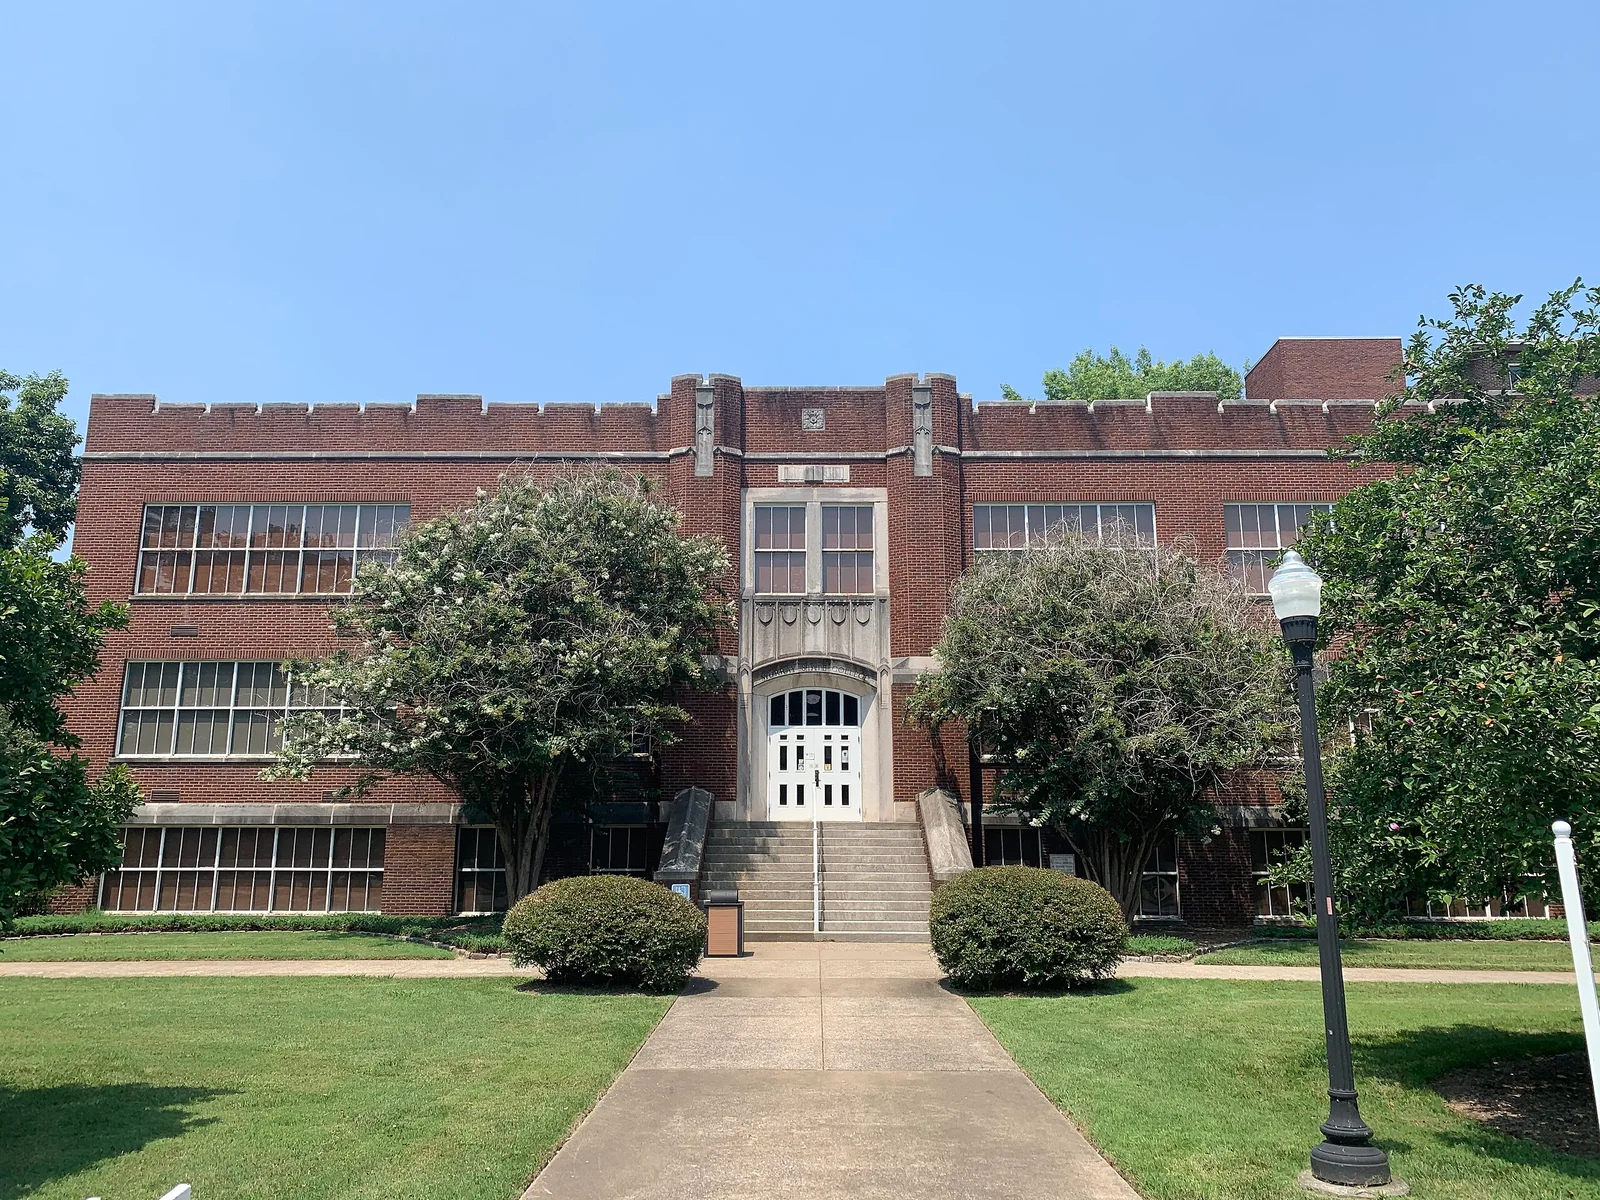
NCAA Division IMissouri Valley ConferenceKentucky

Murray State University Baseball
One plan built for Murray State University Baseball, with the roster read, the coach's contact and a dated plan, delivered within 24 hours. An expert checks every plan.
- 37
- Roster
- 24
- Leaving
- 13%
- In-state
- 35%
- Transfers
Overview
Murray State University Baseball Team Details
Key facts about the Murray State University baseball team.
Murray State University plays Division I baseball in the Missouri Valley Conference from its campus in Murray, Kentucky. After the 2026-27 season, it loses 12 pitchers, the most of any position group, followed by five outfielders. Winning is a habit, with five straight seasons above .500.
NCAA Division IMissouri Valley ConferenceKentucky
- Head coach
- Dan Skirka
- Home venue
- Johnny Reagan Field at Taylor Family Park
- Average roster
- 43
- Five-year win rate
- 60%
Head Coach
players a season
Fit check
Do You Fit at Murray State University?
Pick your position and level, add a test score if you have one, and get an instant read on your chances here. Free, and no account needed.
Coaching staff
Get on This Staff's Radar
Head coach
Dan SkirkaHead CoachEmail●●●●●●@●●●●.edu
Phone(●●●) ●●●-●●●●
Roster
Roster Breakdown
The roster by class
3FreshmenFr.
1SophomoresSo.
9JuniorsJr.
18SeniorsSr.
6GraduateGrad
37 players on the latest roster (2027).
Roster openings after 2026-27
24players in their final year, 65% of the roster
Pitcher 12 · Catcher 3 · Infielder 4 · Outfielder 5
The Class of 2027 walks into more openings than most, with 24 players, 65% of the roster, set to leave after the 2026-27 season, compared with a median of 26% among Division I baseball teams. After that season, 12 pitchers will leave, the largest group of departures by position, followed by five outfielders. Recruits at those positions would face the least entrenched competition.
See who you would be replacingWith 65% of the roster made up of seniors and graduate students, this is a veteran group. Many of last season's non-seniors are gone, as just 50% are back, against a 61% median among Division I baseball teams. Recruits may find roles open up faster than on a settled roster.
Positions
Baseball Roster by Position
How many players a season the program carries at each position, and how tall they are.
Pitcher
18.7players a season
Average height 6'1"
Catcher
4.7players a season
Average height 6'0"
Infielder
6.7players a season
Average height 6'1"
Outfielder
6players a season
Average height 6'1"
Utility/Designated Hitter
1.7players a season
Average height 5'11"
Catchers account for 15% of the roster, around five a year, versus 11% on the typical Division I baseball team.
Transfers
Transfers In and Out
13
transfers in for 2026-27
5
transfers out
- Share of the roster
- 35%
- Per 100 freshmen
- 433
- By position
- Pitcher 5 · Catcher 1 · Infielder 2 · Outfielder 5
- Came from
- 10 from Division I, 1 from Division II, 1 from Division III, 1 from NAIA
Footprint
Where This Team Recruits
Where the players are from
112players
In-state13.4%
Other US states85.7%
International0.9%
Counted from players on recent rosters with a known hometown.
Top home states
Kentucky13%
Illinois13%
Indiana11%
Tennessee8%
Florida7%
Recruiting reaches far past Kentucky, which accounts for just 13% of the roster versus 40% for the median team among Division I baseball teams.
Results
Murray State University Baseball Recent Results
Swipe to see every season
2022
55%30-25overall
11-13conference
2023
53%31-28overall
14-13conference
2024
65%37-20overall
17-10conference
Best season
2025
72%44-17overall
17-8conference
Latest
2026
55%33-27overall
15-9conference
Every season from 2022 to 2026 ended above .500, a run of five that adds up to a 60% winning percentage. On the other side, the 2026 season brought a dip: 33-27, down from 44-17 in 2025, or 17 points of winning percentage.
Standings
Missouri Valley Conference Standings
Where Murray State University stands in the Missouri Valley Conference.
Schedule and travel
Baseball Schedule
The season's games, home and away, and how far the team travels.
Recruiting
Recruiting Outlook
Murray State is a highly competitive NCAA Division I program in the Missouri Valley Conference. Recent postseason success, a strong conference standing, and a roster that includes junior college, four-year transfer, and high school players point to a structured recruiting process with limited opportunities for unproven athletes.
Recent MVC tournament success2026 MVC preseason favoriteRoster built across high school, JUCO, and transfer pathways
Recruiting difficulty
80/ 100Hard
OpenCompetitiveSelectiveElite
Murray State operates at a strong Division I and Missouri Valley Conference level, making roster competition difficult even though it is not consistently positioned as a national elite program.
What coaches value
- Reliable position-specific tools, including bat speed, defensive range, receiving ability, or measurable pitching velocity
- Pitchability, command, and the ability to execute multiple pitches in competitive counts
- Defensive versatility and the ability to contribute in more than one role
- Consistent performance, physical development, academic responsibility, and coachability
How to get recruited here
Build a complete recruiting profile with verified measurables, recent video, academic information, and competitive statistics. Email the baseball staff with a concise introduction, position, graduation year, schedule, and links to full-game footage, then keep them updated as your performance and physical tools develop.
How hard is it to make the team
Making Murray State's baseball team is difficult because it is a competitive Division I program with recent Missouri Valley Conference success and a roster containing experienced transfers, junior college players, and returning athletes. A realistic candidate should already show Division I-level tools or clear upside, while walk-on opportunities should be treated as uncertain rather than expected.
Who fits this program
- Baseball players should be prepared for highly competitive Division I play.
- Student-athletes must balance demanding baseball commitments with college academics.
- The medium-sized suburban campus suits athletes preferring residential college-town routines.
- Athletes from high school, junior college, and transfer pathways may fit.
Program stats
The Program by the Numbers
40
Athletes on the roster
4
Coaches on staff
$8,920
Spent per athlete
Spending and revenue a year
Spending$1,145,197
Revenue$1,364,684
Revenue covers everything the program spends.
Reported revenue of about $1.4 million in the 2025 EADA report exceeds spending of $1.1 million, a gap of 19% of expenses.
Source: the federal Equity in Athletics report, 2025.
Feeders
Top Feeder Schools and Clubs
The high schools and clubs that sent the most players to this roster.
1Madison Central High School2 players on recent rosters
2Mater Dei High School2 players on recent rosters
The school
School Environment
Murray State University emphasizes applied learning in agriculture, business and other career-focused fields, giving recruits a useful starting point for weighing coursework, admissions expectations, faculty access and outcomes after college.
Murray State UniversityMurray, KentuckySee the full profile 86%
Acceptance rate
61%
Graduation rate
- Undergraduates
- 7,851
- Net price a year
- $9,096
- Earnings after ten years
- $44,737
Official links
Official Murray State University Baseball Links
Similar programs
Similar Baseball Teams
Programs at a similar level, with similar academics, worth adding to your recruiting list.
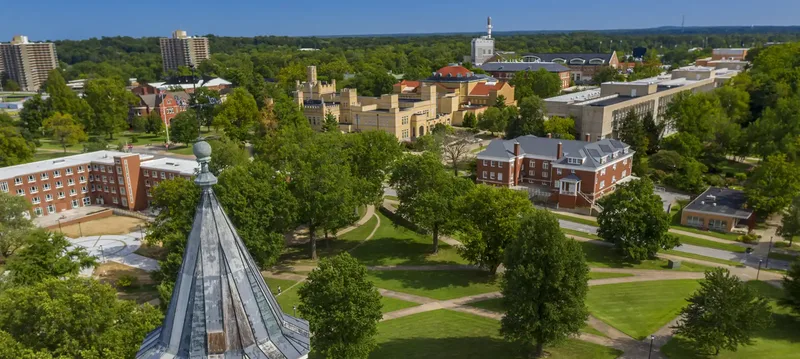

Athletes come for competitive athletics, practical academic options and relatively affordable costs in a college-town setting.


Career-focused programs, Gulf Coast surroundings and relatively affordable tuition give athletes practical reasons to consider studying here.


Research opportunities, South Florida internships and competitive athletics give recruits reasons to look beyond the coastal setting.
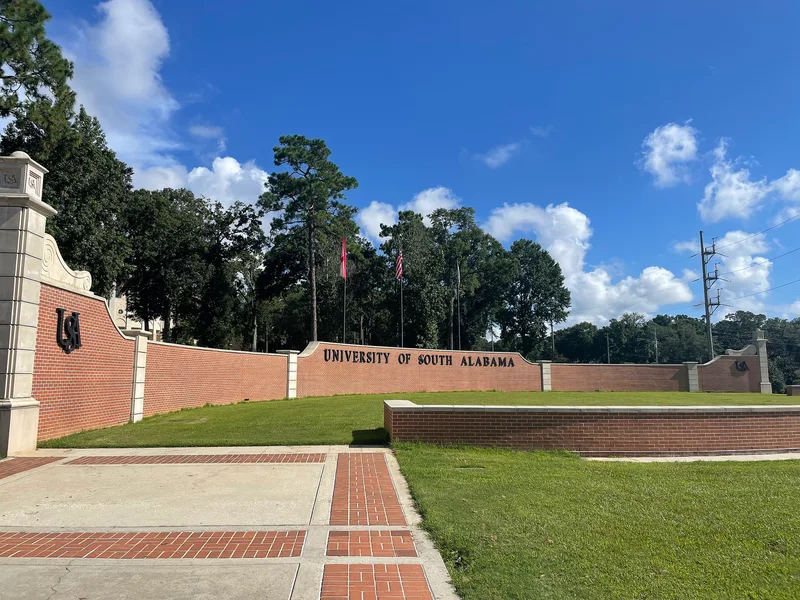

Health-focused academics, Sun Belt competition and scholarship opportunities give athletes practical reasons to consider this Mobile campus.


Health-focused academics, Southern Conference competition and Appalachian recreation give athletes distinct reasons to consider this campus.
Teams in Kentucky
More Baseball Teams in Kentucky
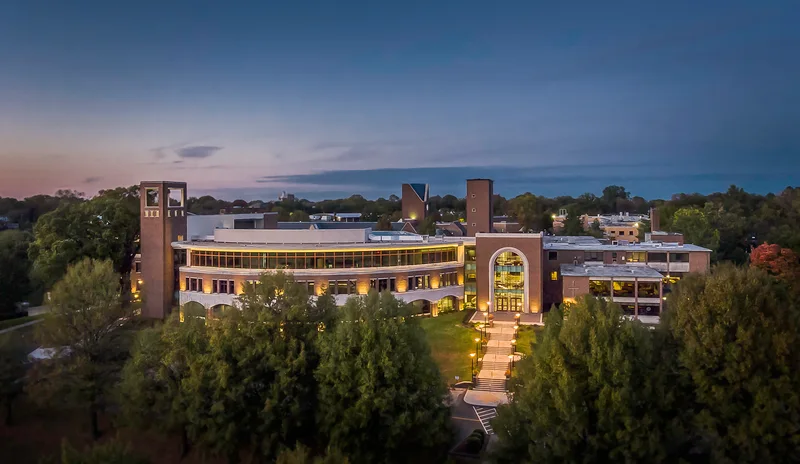

Bellarmine University
Louisville, KY
Personal instruction, career-focused programs and Louisville opportunities give athletes reasons to look beyond the competition schedule.
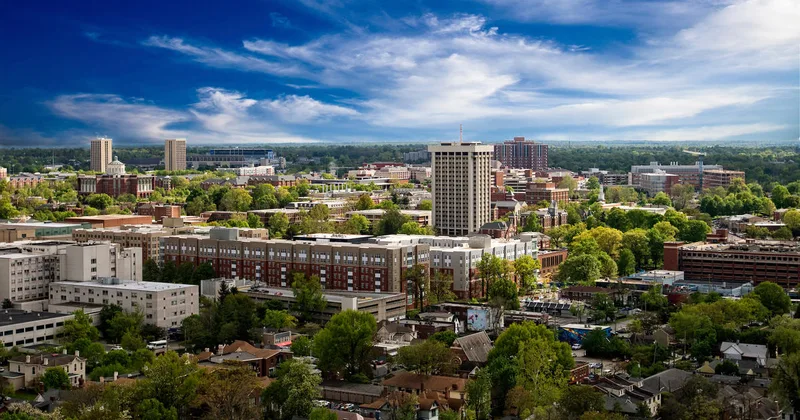

University of Kentucky
Lexington, KY
SEC competition, research opportunities and in-state value draw athletes who want a broad university experience.
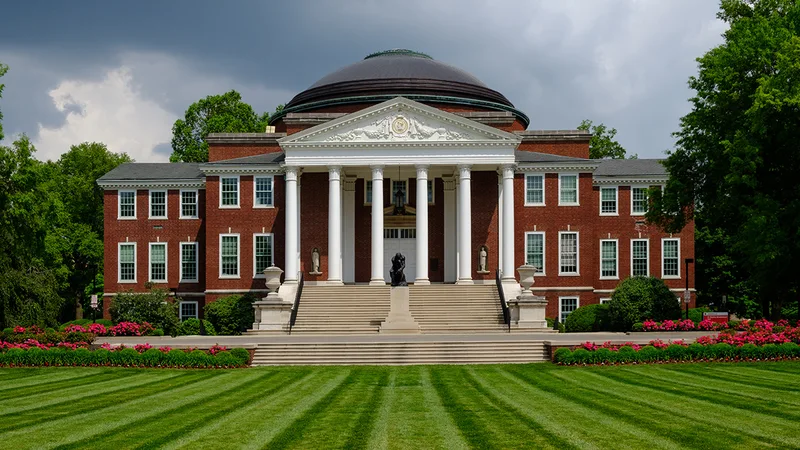

University of Louisville
Louisville, KY
ACC competition, health-focused academics and an urban setting give athletes distinct reasons to consider Louisville.
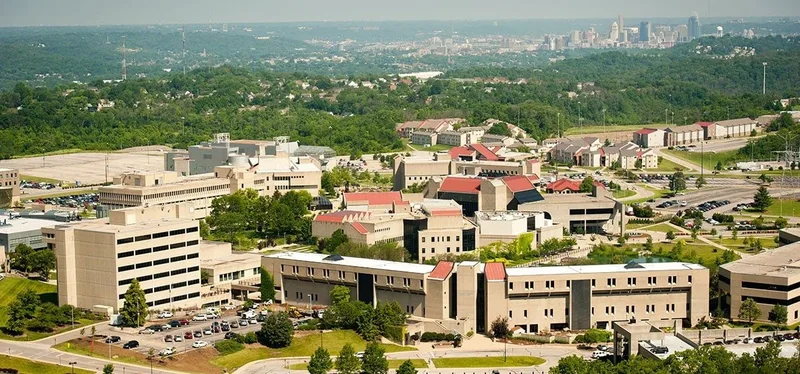

Northern Kentucky University
Highland Heights, KY
Division I competition, affordable costs and nearby Cincinnati opportunities make this a practical option for recruits.
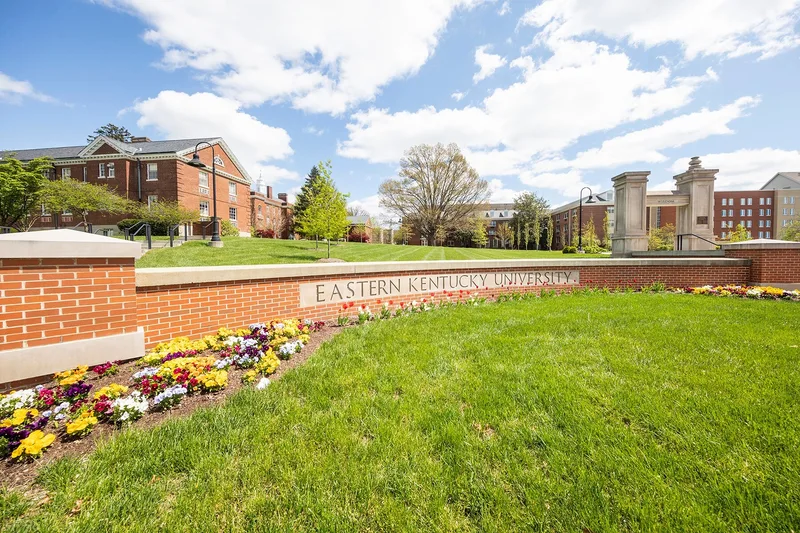

Eastern Kentucky University
Richmond, KY
Accessible admissions, applied academics and relatively affordable tuition give athletes practical reasons to pursue Division I competition here.


Morehead State University
Morehead, KY
Competitive athletics, hands-on academics and regional affordability give recruits several practical reasons to consider studying here.


Western Kentucky University
Bowling Green, KY
Competitive athletics, accessible admissions and a residential hilltop setting appeal to athletes seeking a balanced college experience.
Roster openings · 2026-27
Which D1 Baseball programs have the most roster spots opening up?
Every program ranked by players in their final year, with the positions they are losing.
10.2players leaving per program, on average
See the programs Three ways to start
Where are you in the search?
Pick the option that matches where you are, and we will show you the plan that fits.
Recruiting Plan
Your 20 to 25 best-fit schools, picked for you.



- Starter: the list, fit reads, real costs and a dated timeline
- Complete: adds roster reads and coach emails for every school
$99 or $249Starter or Complete, one time
Build my plan
Roster Report
The roster at your position, at the schools you pick.


- Who is graduating at your position, class year by class year
- Where spots are likely to open, in plain words
From $193, 8 or 15 schools
Choose my schools
School Plan
One school, covered end to end.
- Your honest odds, the roster and the verified coach
- Intro email, three follow-ups, admissions steps and timeline
$49One school, one time
Pick my school Resources