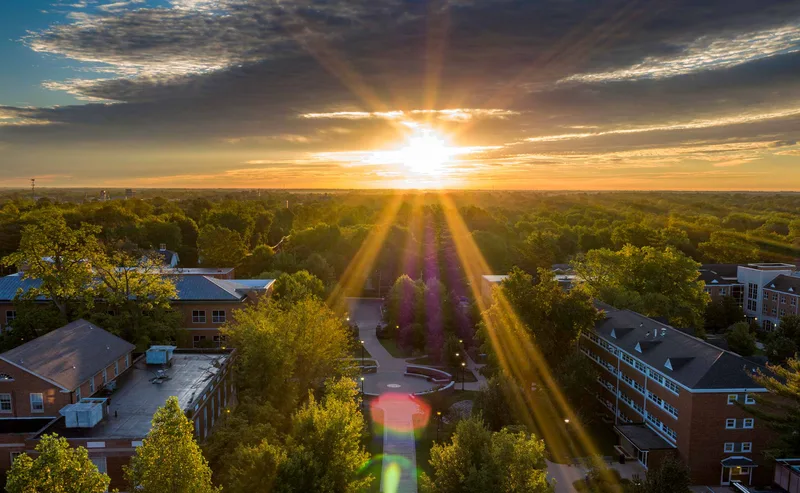

Close faculty connections, Midwest Conference competition and need-based aid make this small campus worth considering.
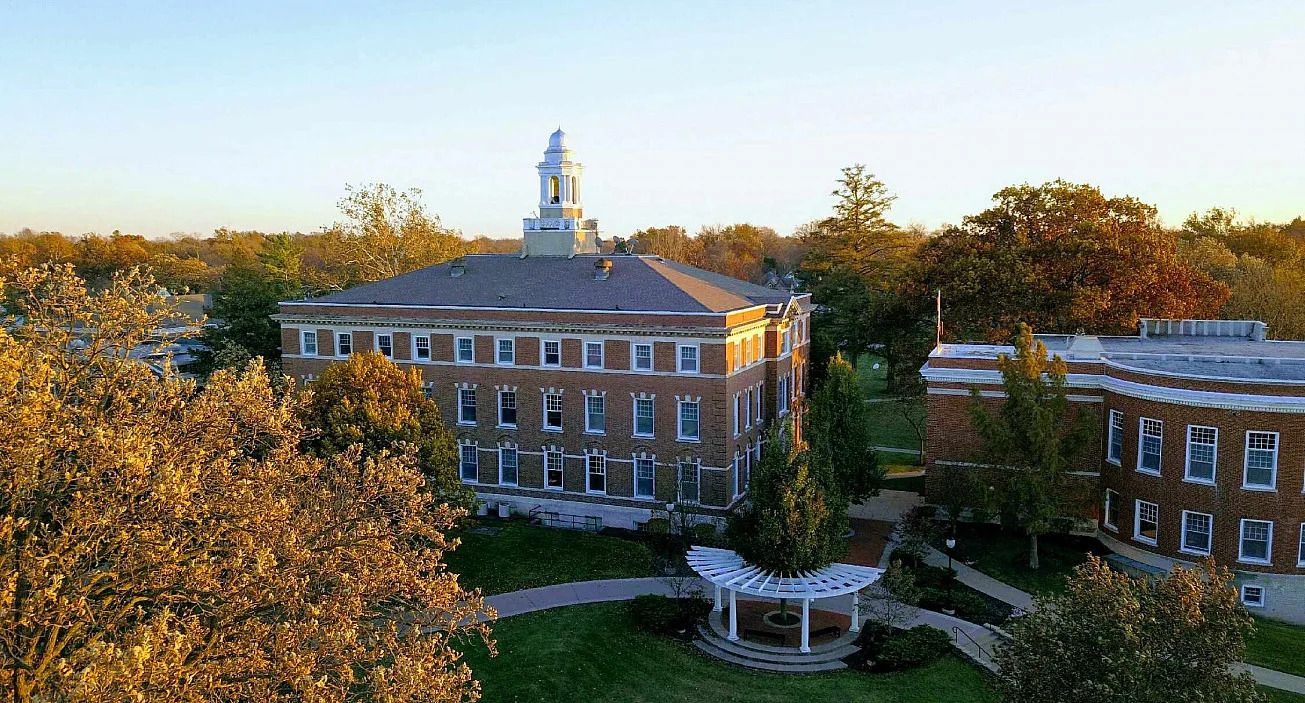
NCAA Division IIIMidwest ConferenceIllinois

Monmouth College Football
One plan built for Monmouth College Football, with the roster read, the coach's contact and a dated plan, delivered within 24 hours. An expert checks every plan.
- 132
- Roster
- 27
- Leaving
- 68%
- In-state
- 1%
- Transfers
Overview
Monmouth College Football Team Details
Key facts about the Monmouth College football team.
From its campus in Monmouth, Illinois, Monmouth College competes in Division III football as a member of the Midwest Conference. After the 2026-27 season, it loses seven defensive backs, the most of any position group, followed by five offensive linemen. It has finished above .500 in each of the last five seasons.
NCAA Division IIIMidwest ConferenceIllinois
- Head coach
- Chad Braun
- Home venue
- April Zorn Memorial Stadium
- Average roster
- 125
- Five-year win rate
- 80%
Head Coach, Defensive Coordinator
players a season
Fit check
Do You Fit at Monmouth College?
Pick your position and level, add a test score if you have one, and get an instant read on your chances here. Free, and no account needed.
Coaching staff
Get on This Staff's Radar
Head coach
Chad BraunHead Coach, Defensive CoordinatorEmail●●●●●●@●●●●.edu
Phone(●●●) ●●●-●●●●
Roster
Roster Breakdown
The roster by class
51FreshmenFr.
40SophomoresSo.
14JuniorsJr.
27SeniorsSr.
132 players on the latest roster (2026).
Roster openings after 2026-27
27players in their final year, 21% of the roster
Quarterback 2 · Running Back 3 · Wide Receiver 4 · Tight End 1 · Offensive Line 5 · Defensive Line 2 · Linebacker 2 · Defensive Back 7 · Specialist 1
After the 2026-27 season, seven defensive backs will leave, the largest group of departures by position, followed by five offensive linemen. After that season, 27 players are set to leave, 20% of the current roster and a share in the top quarter among Division III football teams, which leaves room for the Class of 2027. Recruits at those positions would face the least entrenched competition.
See who you would be replacingRoughly 39% of the roster is in its first year, 51 of 132, which leaves much of the lineup still developing. Coaches carry 132 players here, well above the 109 typical among Division III football teams. A bigger roster tends to mean more competition for a lineup spot.
Positions
Football Roster by Position
How many players a season the program carries at each position, and how tall they are.
Quarterback
7players a season
Average height 6'1"
Running Back
11.3players a season
Average height 5'9"
Wide Receiver
22.7players a season
Average height 6'0"
Tight End
4.3players a season
Average height 6'2"
Offensive Line
16.7players a season
Average height 6'2"
Defensive Line
20.7players a season
Average height 6'0"
Linebacker
17players a season
Average height 5'11"
Defensive Back
21players a season
Average height 6'0"
Specialist
4players a season
Average height 5'10"
Transfers
Transfers In and Out
1
transfers in for 2026-27
2
transfers out
- Share of the roster
- 1%
- Per 100 freshmen
- 2
- By position
- Quarterback 1
- Came from
- 1 from Division III
Footprint
Where This Team Recruits
Where the players are from
371players
In-state67.7%
Other US states32.3%
International0%
Counted from players on recent rosters with a known hometown.
Top home states
Illinois68%
Florida24%
Missouri3%
Texas2%
Iowa2%
Most players come from just a handful of states, with the top five adding up to 98% of the roster versus a 91% median among Division III football teams.
Results
Monmouth College Football Recent Results
Swipe to see every season
2021
80%8-2overall
8-1conference
2022
82%9-2overall
8-1conference
2023
82%9-2overall
8-1conference
2024
73%8-3overall
8-1conference
Best season
2025
82%9-2overall
9-0conference
Since 2021, the program has not had a losing season, and its win rate over that run is 80%. Midwest Conference play went 9-0 in 2025, a stronger mark than the 9-2 record overall.
Standings
Midwest Conference Standings
Where Monmouth College stands in the Midwest Conference.
Schedule and travel
Football Schedule
The season's games, home and away, and how far the team travels.
Recruiting
Recruiting Outlook
Who fits this program
- Competes in NCAA Division III Midwest Conference structure
- Moderate academic demands balanced with athletic commitments
- Small rural campus fosters tight community interaction
- Football athletes who seek meaningful playing time and growth
Program stats
The Program by the Numbers
117
Athletes on the roster
8
Coaches on staff
$720
Spent per athlete
Spending and revenue a year
Spending$383,485
Revenue$383,485
Revenue covers everything the program spends.
According to the 2025 EADA report, the program spends around $690 per athlete on operations, about half of the Division III median. Coaching time is shared widely, at about 15 athletes per coach in the same report, above the median of 11 among Division III football teams.
Source: the federal Equity in Athletics report, 2025.
The school
School Environment
Monmouth College combines a liberal arts foundation with strengths in chemistry and engineering, giving athletes opportunities to explore academic interests through undergraduate research, internships and close faculty relationships.
Monmouth CollegeMonmouth, IllinoisSee the full profile 91%
Acceptance rate
65%
Graduation rate
- Undergraduates
- 713
- Net price a year
- $17,133
- Earnings after ten years
- $51,110
Official links
Official Monmouth College Football Links
Similar programs
Similar Football Teams
Programs at a similar level, with similar academics, worth adding to your recruiting list.


A close residential community helps athletes combine competitive sports, hands-on learning and involvement beyond their teams.

Close faculty relationships and career-focused academics appeal to athletes seeking a small campus and competitive athletics.


Athletes can combine Division III competition with career-focused study, accessible admissions and Connecticut in-state tuition advantages.


Residential campus life and hands-on learning give athletes ways to build connections and prepare for careers.


Hands-on academics, career connections and Division III competition appeal to athletes who want a practical college experience.
Teams in Illinois
More Football Teams in Illinois
Augustana College
Rock Island, IL
Residential campus life and hands-on learning give athletes ways to build connections and prepare for careers.


Aurora University
Aurora, IL
Career-focused study, competitive athletics and a residential campus near Chicago give athletes practical reasons to consider Aurora.
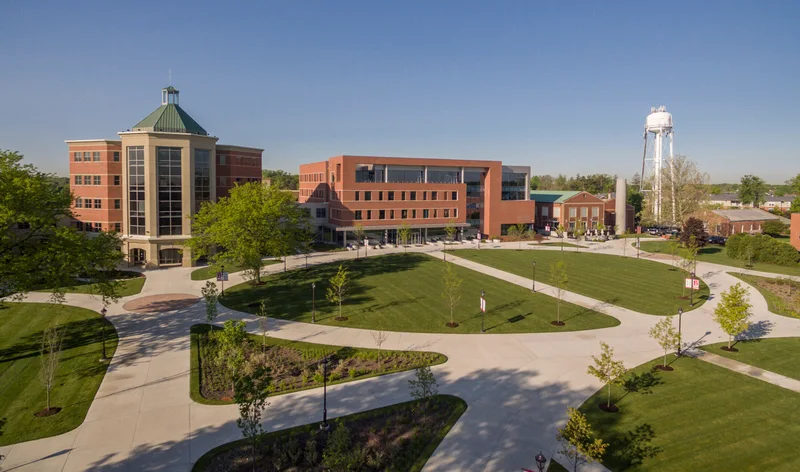

Benedictine University
Lisle, IL
Personalized instruction, career-focused majors and suburban Chicago access complement a competitive Division III athletic experience.
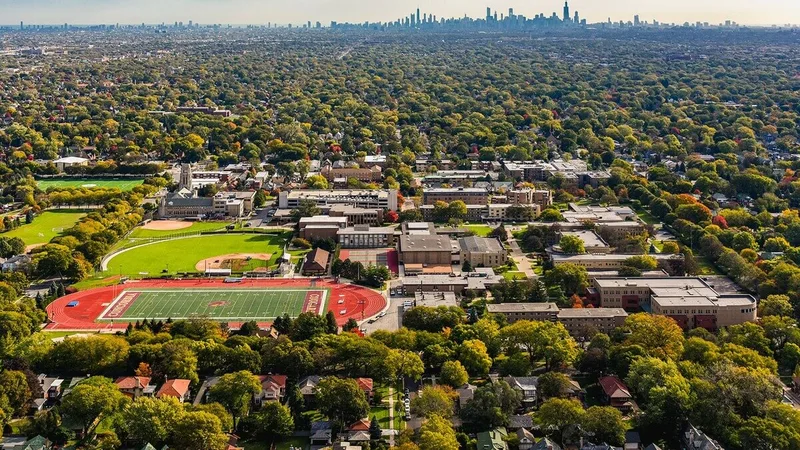

Concordia University Chicago
River Forest, IL
A small campus, accessible admissions and Chicago connections give athletes room to pursue sports and career goals.


Elmhurst University
Elmhurst, IL
A small academic community and suburban Chicago location complement competitive athletics and career-focused study.


Eureka College
Eureka, IL
Close faculty connections and experiential learning appeal to athletes seeking a small college with meaningful career preparation.
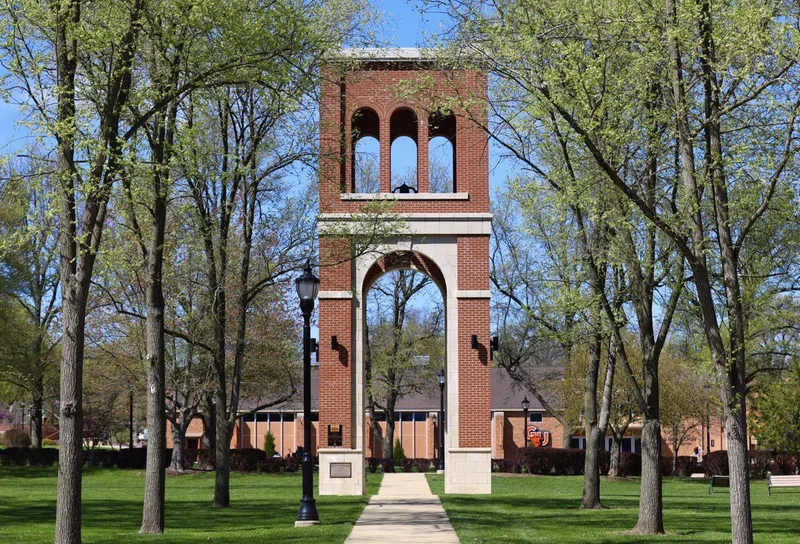

Greenville University
Greenville, IL
A residential community and personal faculty attention appeal to athletes seeking a smaller college experience.
Illinois College
Jacksonville, IL
Close faculty connections, Midwest Conference competition and need-based aid make this small campus worth considering.


Illinois Wesleyan University
Bloomington, IL
Athletes choose a residential community that pairs competitive CCIW athletics with professional programs and financial aid options.


Knox College
Galesburg, IL
Close faculty relationships and hands-on learning appeal to athletes seeking a small campus and Midwest Conference competition.
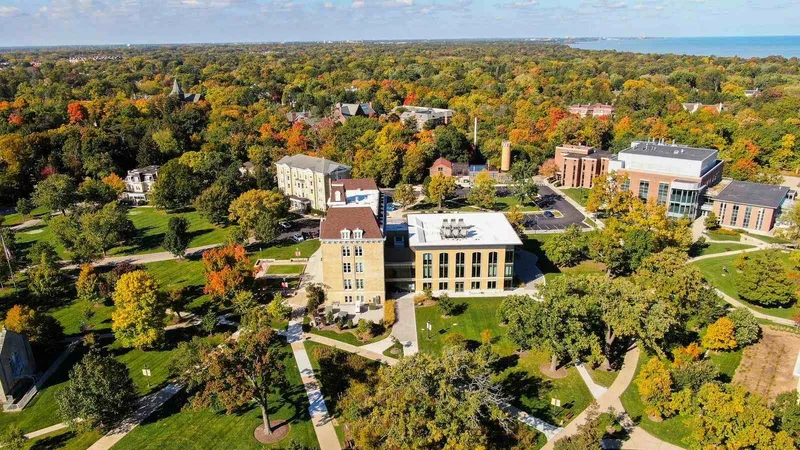

Lake Forest College
Lake Forest, IL
Close faculty relationships and Chicago internship access help athletes connect their college experience with career goals.


Millikin University
Decatur, IL
Hands-on learning, close faculty relationships and competitive athletics give recruits a clear picture of the experience here.
Roster openings · 2026-27
Which D3 Football programs have the most roster spots opening up?
Every program ranked by players in their final year, with the positions they are losing.
17.9players leaving per program, on average
See the programs Three ways to start
Where are you in the search?
Pick the option that matches where you are, and we will show you the plan that fits.
Recruiting Plan
Your 20 to 25 best-fit schools, picked for you.



- Starter: the list, fit reads, real costs and a dated timeline
- Complete: adds roster reads and coach emails for every school
$99 or $249Starter or Complete, one time
Build my plan
Roster Report
The roster at your position, at the schools you pick.


- Who is graduating at your position, class year by class year
- Where spots are likely to open, in plain words
From $193, 8 or 15 schools
Choose my schools
School Plan
One school, covered end to end.
- Your honest odds, the roster and the verified coach
- Intro email, three follow-ups, admissions steps and timeline
$49One school, one time
Pick my school Resources