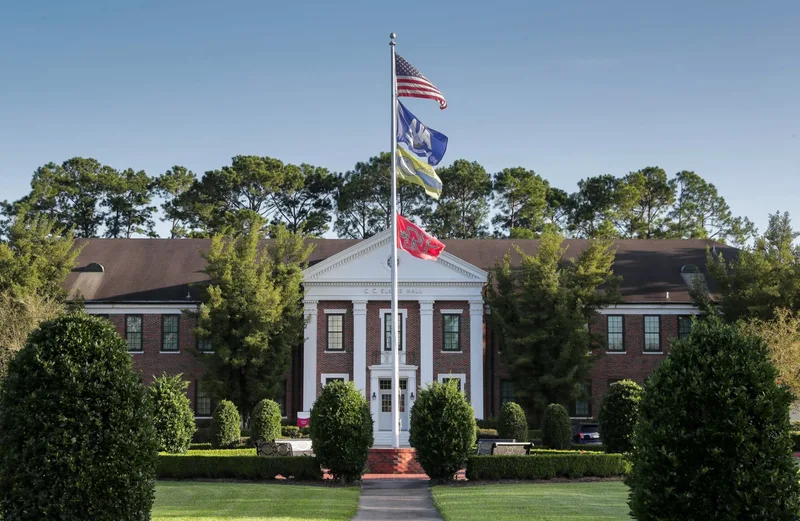
Northwestern State University of Louisiana
Natchitoches, LA
Why it is similar: Same conference and state.Southland Conference competition, nursing programs and in-state value give recruits practical reasons to consider this campus.
Browse programs
College directoryEvery program, filtered by what fits Sport directoryMen's and women's, every division State directoryPrograms in the states you would play inGo deeper
Major directoryYour major and your sport in one list Camp directoryID camps and showcases at college programs Conference directoryEvery conference and its member colleges

One plan built for McNeese State University Women's Track & Field, with the roster read, the coach's contact and a dated plan, delivered within 24 hours. An expert checks every plan.
Overview
Key facts about the McNeese State University women's track & field team.
McNeese State University plays Division I women's track and field in the Southland Conference from its campus in Lake Charles, Louisiana. Roster continuity is a strength, as 97% of last season's non-seniors are back, above the 82% median among Division I women's track and field teams. After the 2026-27 season, only five athletes are set to leave, 16% of the roster and low among Division I women's track and field teams.
Head Coach - Middle Distance/Long Distance
players a season
Fit check
Pick your position and level, add a test score if you have one, and get an instant read on your chances here. Free, and no account needed.
Coaching staff
Head coach
Brendon GilroyHead Coach - Middle Distance/Long DistanceRoster
The roster by class
32 players on the latest roster (2027).
Roster openings after 2026-27
Sprints 1 · Distance 1 · Jumps 1 · Throws 2
Few athletes are set to leave after the 2026-27 season, only five athletes and 16% of the roster, which makes the room for the Class of 2027 tighter than most among Division I women's track and field teams. Position by position, throwers lead the departures, with two leaving after that season. Fewer departures mean fewer open spots for incoming recruits.
See who you would be replacingAmong athletes who were not in their final year last season, 97% are back, a sign of a stable program. Transfers in make up 9% of the current roster, three athletes who previously played at another college, which is high among Division I women's track and field teams.
Positions
How many players a season the program carries at each position, and how tall they are.
Roster spots lean toward throwers: 23% of the roster, compared with 13% on the average Division I women's track and field team. At 7% of the roster, jumpers trail what the average Division I women's track and field team carries, which is 16%.
Footprint
Where the players are from
Counted from players on recent rosters with a known hometown.
Top home states
International athletes make up 25% of the roster, in the top quarter among Division I women's track and field teams, where the median is 8%, including several from the United Kingdom, Kenya, and Ireland.
Schedule and travel
The season's games, home and away, and how far the team travels.
Recruiting
Who fits this program
Program stats
Athletes on the roster
Coaches on staff
Spent per athlete
Spending and revenue a year
Revenue covers everything the program spends.
Source: the federal Equity in Athletics report, 2024.
Feeders
The high schools and clubs that sent the most players to this roster.
The school
McNeese State University emphasizes applied fields such as engineering, nursing and business, making academic preparation, classroom demands and the connection between your major and regional career opportunities important considerations.
 McNeese State UniversityLake Charles, LouisianaSee the full profile
Acceptance rate
Graduation rate
Official links
Similar programs
Programs at a similar level, with similar academics, worth adding to your recruiting list.
Natchitoches, LA
Why it is similar: Same conference and state.Southland Conference competition, nursing programs and in-state value give recruits practical reasons to consider this campus.
Southland competition, career-focused programs and regional affordability give athletes practical reasons to consider this Bayou Region campus.
Accessible admissions, career-focused programs and relatively affordable costs give athletes practical reasons to consider competing here.
Career-focused programs, accessible admissions and a community-oriented setting give athletes practical reasons to consider competing here.
Accessible admissions, applied learning and Division I competition give athletes several reasons to consider this campus.
Division I competition, affordable costs and nearby Cincinnati opportunities make this a practical option for recruits.
Teams in Louisiana
Baton Rouge, LA
Southeastern Conference competition, research opportunities and Baton Rouge employer connections give athletes distinct reasons to consider LSU.
Ruston, LA
Technical academics, accessible admissions and a residential Ruston setting complement the demands of Division I competition.
Thibodaux, LA
Southland competition, career-focused programs and regional affordability give athletes practical reasons to consider this Bayou Region campus.
Natchitoches, LA
Southland Conference competition, nursing programs and in-state value give recruits practical reasons to consider this campus.
Baton Rouge, LA
Athletes are drawn to Division I competition, a supportive HBCU community and opportunities in professional fields.
Roster openings · 2026-27
Every program ranked by players in their final year, with the positions they are losing.
Three ways to start
Pick the option that matches where you are, and we will show you the plan that fits.
Resources