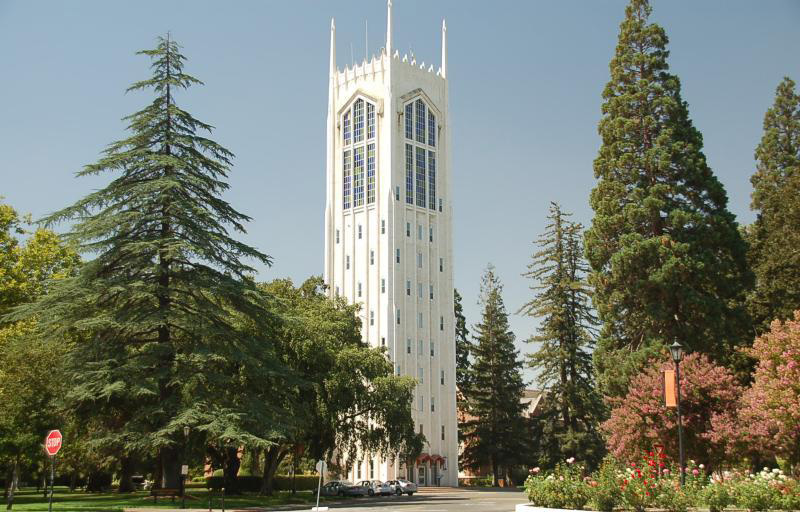

Division I competition, small classes and strong health and professional pathways give athletes clear reasons to consider Pacific.

NCAA Division IWest Coast ConferenceCalifornia

Loyola Marymount University Softball
One plan built for Loyola Marymount University Softball, with the roster read, the coach's contact and a dated plan, delivered within 24 hours. An expert checks every plan.
- 23
- Roster
- 6
- Leaving
- 86%
- In-state
- 9%
- Transfers
Overview
Loyola Marymount University Softball Team Details
Key facts about the Loyola Marymount University softball team.
In Los Angeles, California, Loyola Marymount University competes in Division I softball through the West Coast Conference. The most room for the Class of 2027 is among utility players and designated hitters, with three leaving after the 2026-27 season. It climbed from 22-31 in 2025 to 33-19 in 2026.
NCAA Division IWest Coast ConferenceCalifornia
- Head coach
- Tairia Flowers
- Home venue
- Smith Field
- Average roster
- 22
- Five-year win rate
- 57%
Head Coach
players a season
Fit check
Do You Fit at Loyola Marymount University?
Pick your position and level, add a test score if you have one, and get an instant read on your chances here. Free, and no account needed.
Coaching staff
Get on This Staff's Radar
Head coach
Tairia FlowersHead CoachEmail●●●●●●@●●●●.edu
Phone(●●●) ●●●-●●●●
Roster
Roster Breakdown
The roster by class
4FreshmenFr.
8SophomoresSo.
5JuniorsJr.
3SeniorsSr.
3GraduateGrad
23 players on the latest roster (2027).
Roster openings after 2026-27
6players in their final year, 26% of the roster
Catcher 1 · Infielder 1 · Outfielder 1 · Utility/Designated Hitter 3
Watch utility players and designated hitters for the Class of 2027, since three leave after the 2026-27 season. Recruits at that position would face the least entrenched competition.
See who you would be replacingRoster continuity stands out, since 94% of last season's non-seniors returned, ahead of the 81% median among Division I softball teams. Transfers make up just 9% of the roster, in the bottom quarter among Division I softball teams, where the median is 17%. A recruit should expect returning players to hold an edge for playing time.
Positions
Softball Roster by Position
How many players a season the program carries at each position, and how tall they are.
Pitcher
6players a season
Catcher
3players a season
Infielder
4players a season
Outfielder
5.3players a season
Utility/Designated Hitter
3.7players a season
The infielders group fills just 18% of the roster, around four a season, below the 29% average among Division I softball teams.
Transfers
Transfers In and Out
2
transfers in for 2026-27
1
transfers out
- Share of the roster
- 9%
- Per 100 freshmen
- 50
- By position
- Catcher 1 · Utility/Designated Hitter 1
- Came from
- 2 from Division I
Footprint
Where This Team Recruits
Where the players are from
66players
In-state86.4%
Other US states13.6%
International0%
Counted from players on recent rosters with a known hometown.
Top home states
California86%
Washington6%
Arizona5%
Texas3%
Local ties run strong, with 86% of players from California compared with 32% for the median team among Division I softball teams.
Results
Loyola Marymount University Softball Recent Results
Swipe to see every season
Best season
2022
69%37-17overall
13-2conference
2023
56%28-22overall
12-3conference
2024
53%28-25overall
9-7conference
2025
42%22-31overall
7-8conference
Latest
2026
63%33-19overall
10-8conference
Win rate climbed from 42% in 2025 to 63% in 2026, a 22-point gain that took the record from 22-31 to 33-19.
Standings
West Coast Conference Standings
Where Loyola Marymount University stands in the West Coast Conference.
Schedule and travel
Softball Schedule
The season's games, home and away, and how far the team travels.
Recruiting
Recruiting Outlook
Loyola Marymount softball is a competitive NCAA Division I program in the West Coast Conference with a history of conference success, including back-to-back regular-season titles in 2022 and 2023. The program also schedules strong nonconference competition, so recruits should expect meaningful competition for roster and playing opportunities.
NCAA Division I and West Coast Conference levelBack-to-back WCC regular-season titles in 2022 and 2023Strong nonconference schedule with nationally competitive opponents
Recruiting difficulty
80/ 100Hard
OpenCompetitiveSelectiveElite
This is a highly competitive Division I program where most roster opportunities are likely to favor proven travel-ball or high school recruits with clear position-specific value.
What coaches value
- Reliable pitching command, movement, velocity, and the ability to handle pressure situations
- Consistent defensive execution, range, arm strength, and positional versatility
- Quality at-bats, plate discipline, situational hitting, and dependable baserunning
- Coachability, competitive toughness, academic readiness, and the ability to contribute within a team-oriented program
How to get recruited here
Build a complete recruiting profile with verified measurements, academic information, position-specific statistics, and concise video that shows live-game decision-making. Contact the program early, attend appropriate exposure events, and follow up with updated schedules, results, and video when facing strong competition.
How hard is it to make the team
Making Loyola Marymount's softball team is difficult because it is a Division I program competing in a strong conference and regularly facing high-level nonconference opponents. Recruits generally need to show they can compete immediately in a specific role, while versatility, physical development, and strong academics can improve their overall fit.
Who fits this program
- Softball players should be prepared for highly competitive Division I competition.
- The program suits athletes balancing practices, travel, and demanding coursework.
- A medium-sized residential campus provides an urban Los Angeles setting.
- It may suit athletes interested in communication, business, film, or media pathways.
Videos
Loyola Marymount University Softball Videos
Program stats
The Program by the Numbers
20
Athletes on the roster
3
Coaches on staff
$13,271
Spent per athlete
Spending and revenue a year
Spending$1,986,691
Revenue$1,986,691
Revenue covers everything the program spends.
Operating spending per athlete runs high, at roughly $20,000 in the 2025 EADA report, about 80% above the Division I median.
Source: the federal Equity in Athletics report, 2025.
Feeders
Top Feeder Schools and Clubs
The high schools and clubs that sent the most players to this roster.
1Grand Terrace HS2 players on recent rosters
The school
School Environment
Loyola Marymount University combines challenging coursework with particular strength in film, television and business, making academic fit, faculty access and career direction important considerations alongside your athletic goals.
Loyola Marymount UniversityLos Angeles, CaliforniaSee the full profile 45%
Acceptance rate
79%
Graduation rate
- Undergraduates
- 7,273
- Net price a year
- $48,381
- Earnings after ten years
- $78,349
Official links
Official Loyola Marymount University Softball Links
Similar programs
Similar Softball Teams
Programs at a similar level, with similar academics, worth adding to your recruiting list.


Competitive athletics, approachable faculty and Silicon Valley career opportunities give recruits several reasons to consider this campus.
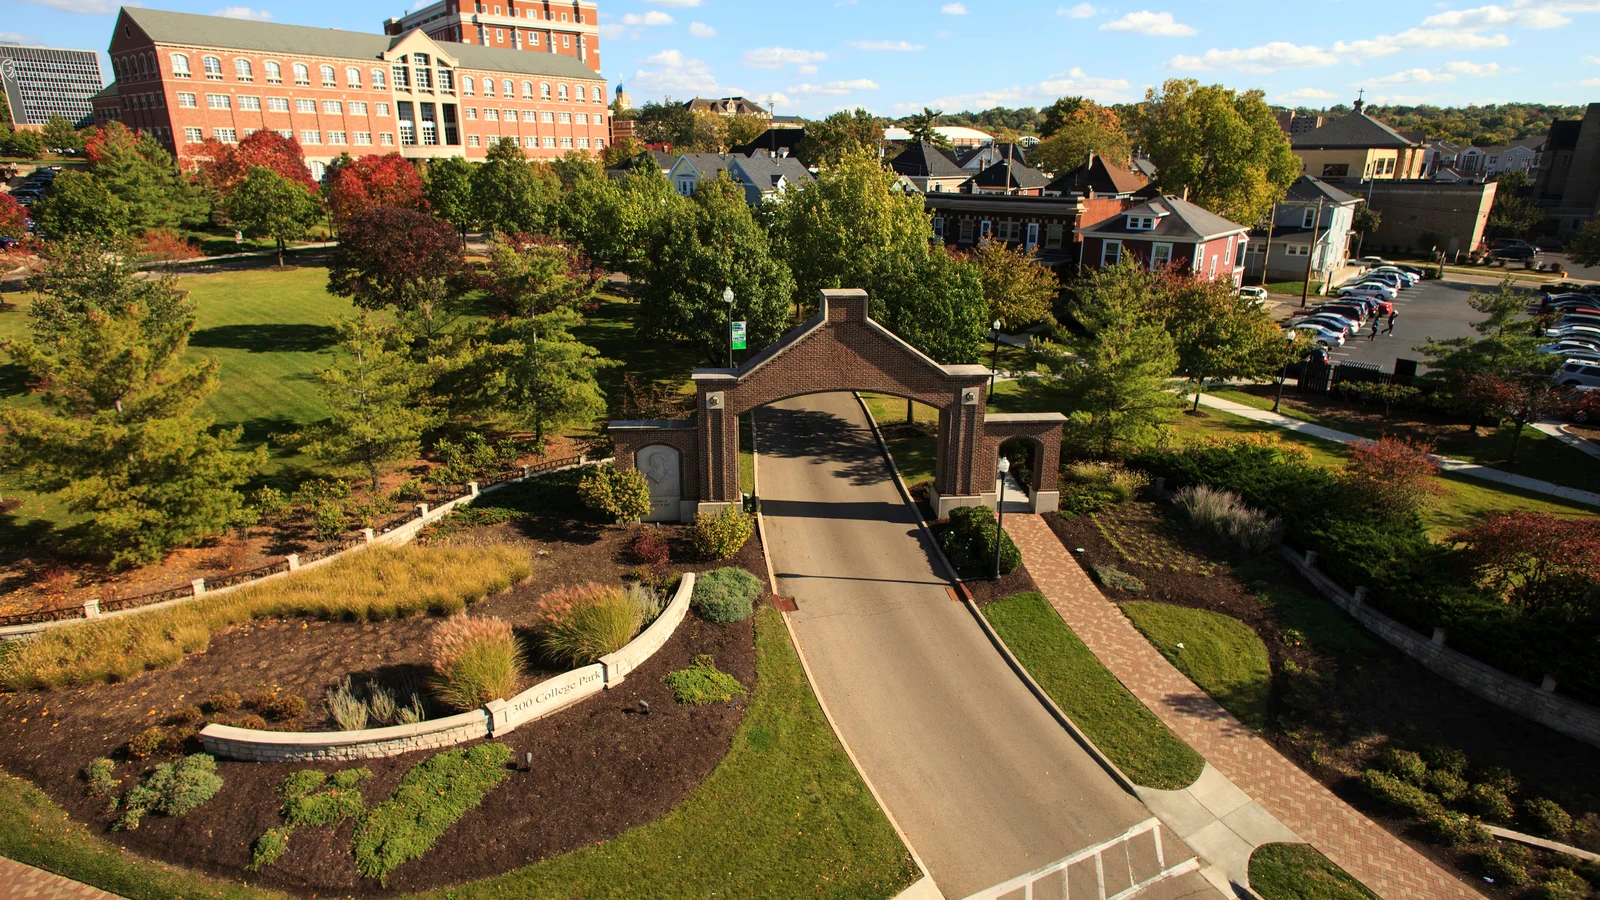

Competitive athletics, career-focused academics and a residential community give recruits reasons to look closely at Dayton.


Research opportunities, Big East competition and a lively residential campus give athletes compelling reasons to consider studying here.
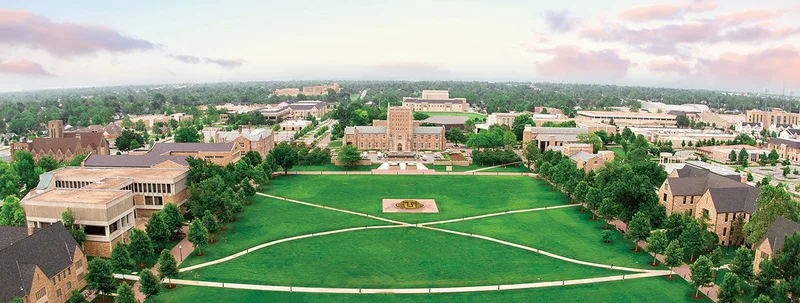

Close faculty connections, professional programs and major-conference competition give athletes a focused campus experience in Tulsa.


Big East competition, career-focused academics and nearby internship opportunities appeal to athletes planning beyond their playing careers.
Teams in California
More Softball Teams in California


California Polytechnic State University
San Luis Obispo, CA
Applied learning, competitive athletics and strong career outcomes appeal to recruits who take academics seriously.
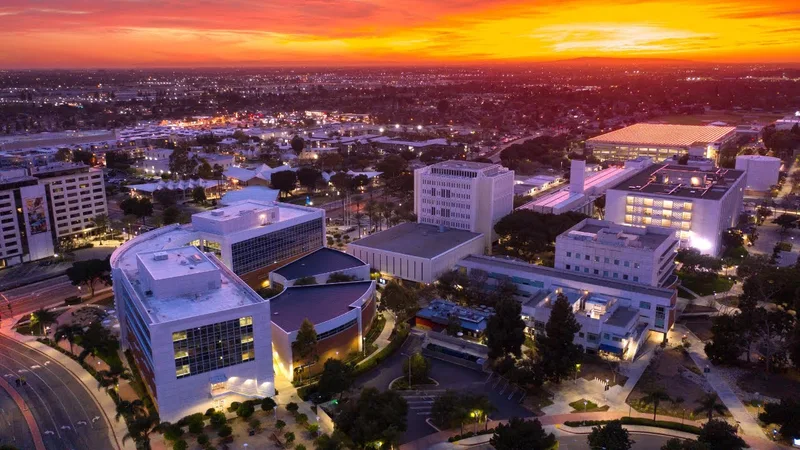

California State University, Fullerton
Fullerton, CA
Competitive athletics, career-focused study and affordable options attract athletes who want a broad university experience.
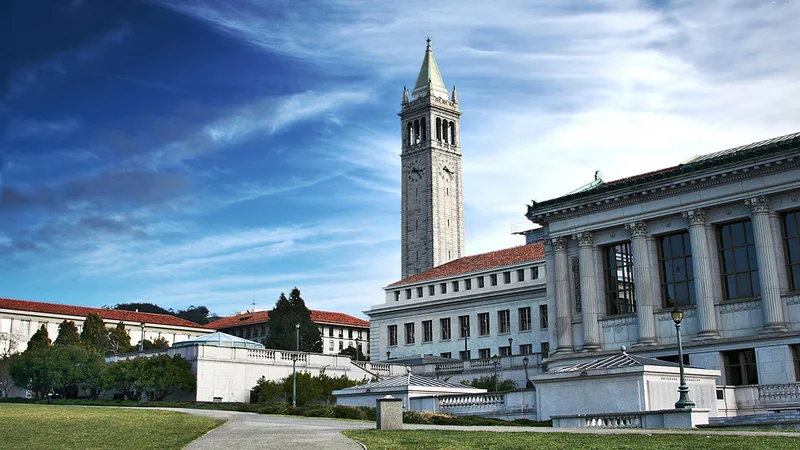

University of California, Berkeley
Berkeley, CA
Demanding academics, competitive athletics and Bay Area career opportunities appeal to athletes with ambitious goals beyond their sport.
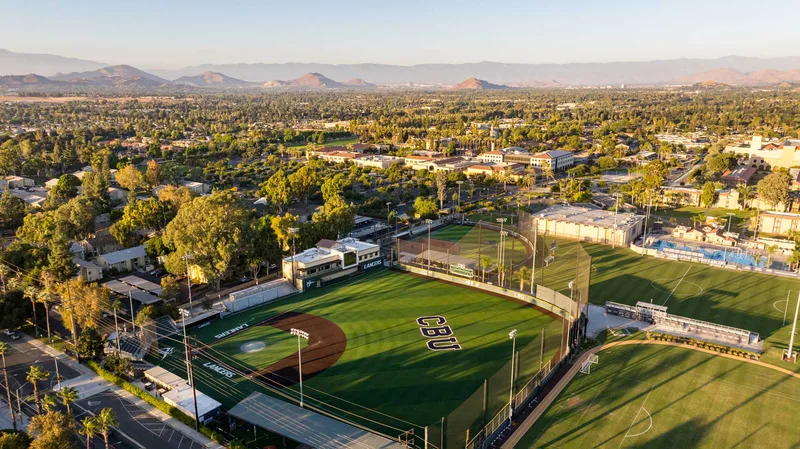

California Baptist University
Riverside, CA
Professional programs, faith-centered campus life and Division I competition give athletes distinct reasons to consider studying here.


California State University, Bakersfield
Bakersfield, CA
Accessible admissions, affordable costs and professional programs give athletes practical reasons to pursue competitive athletics here.
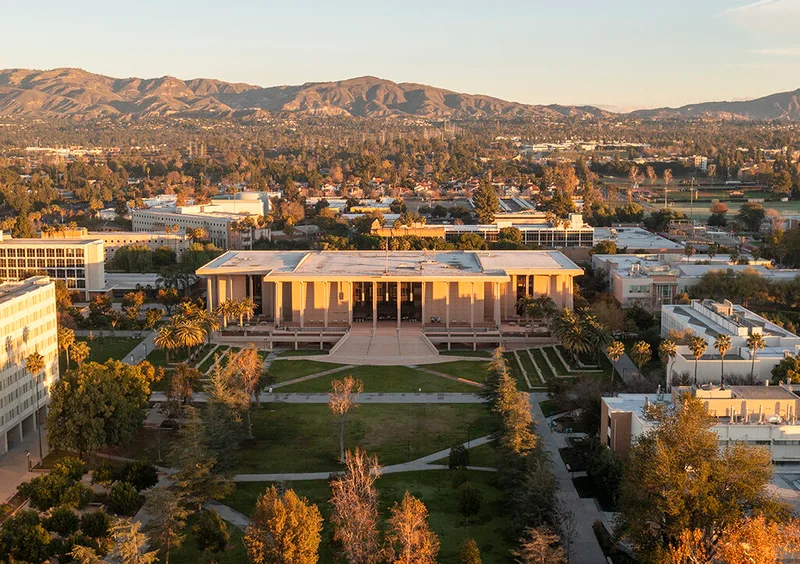

California State University, Northridge
Los Angeles, CA
Accessible admissions, affordable costs and Los Angeles career connections complement the demands of Division I competition.
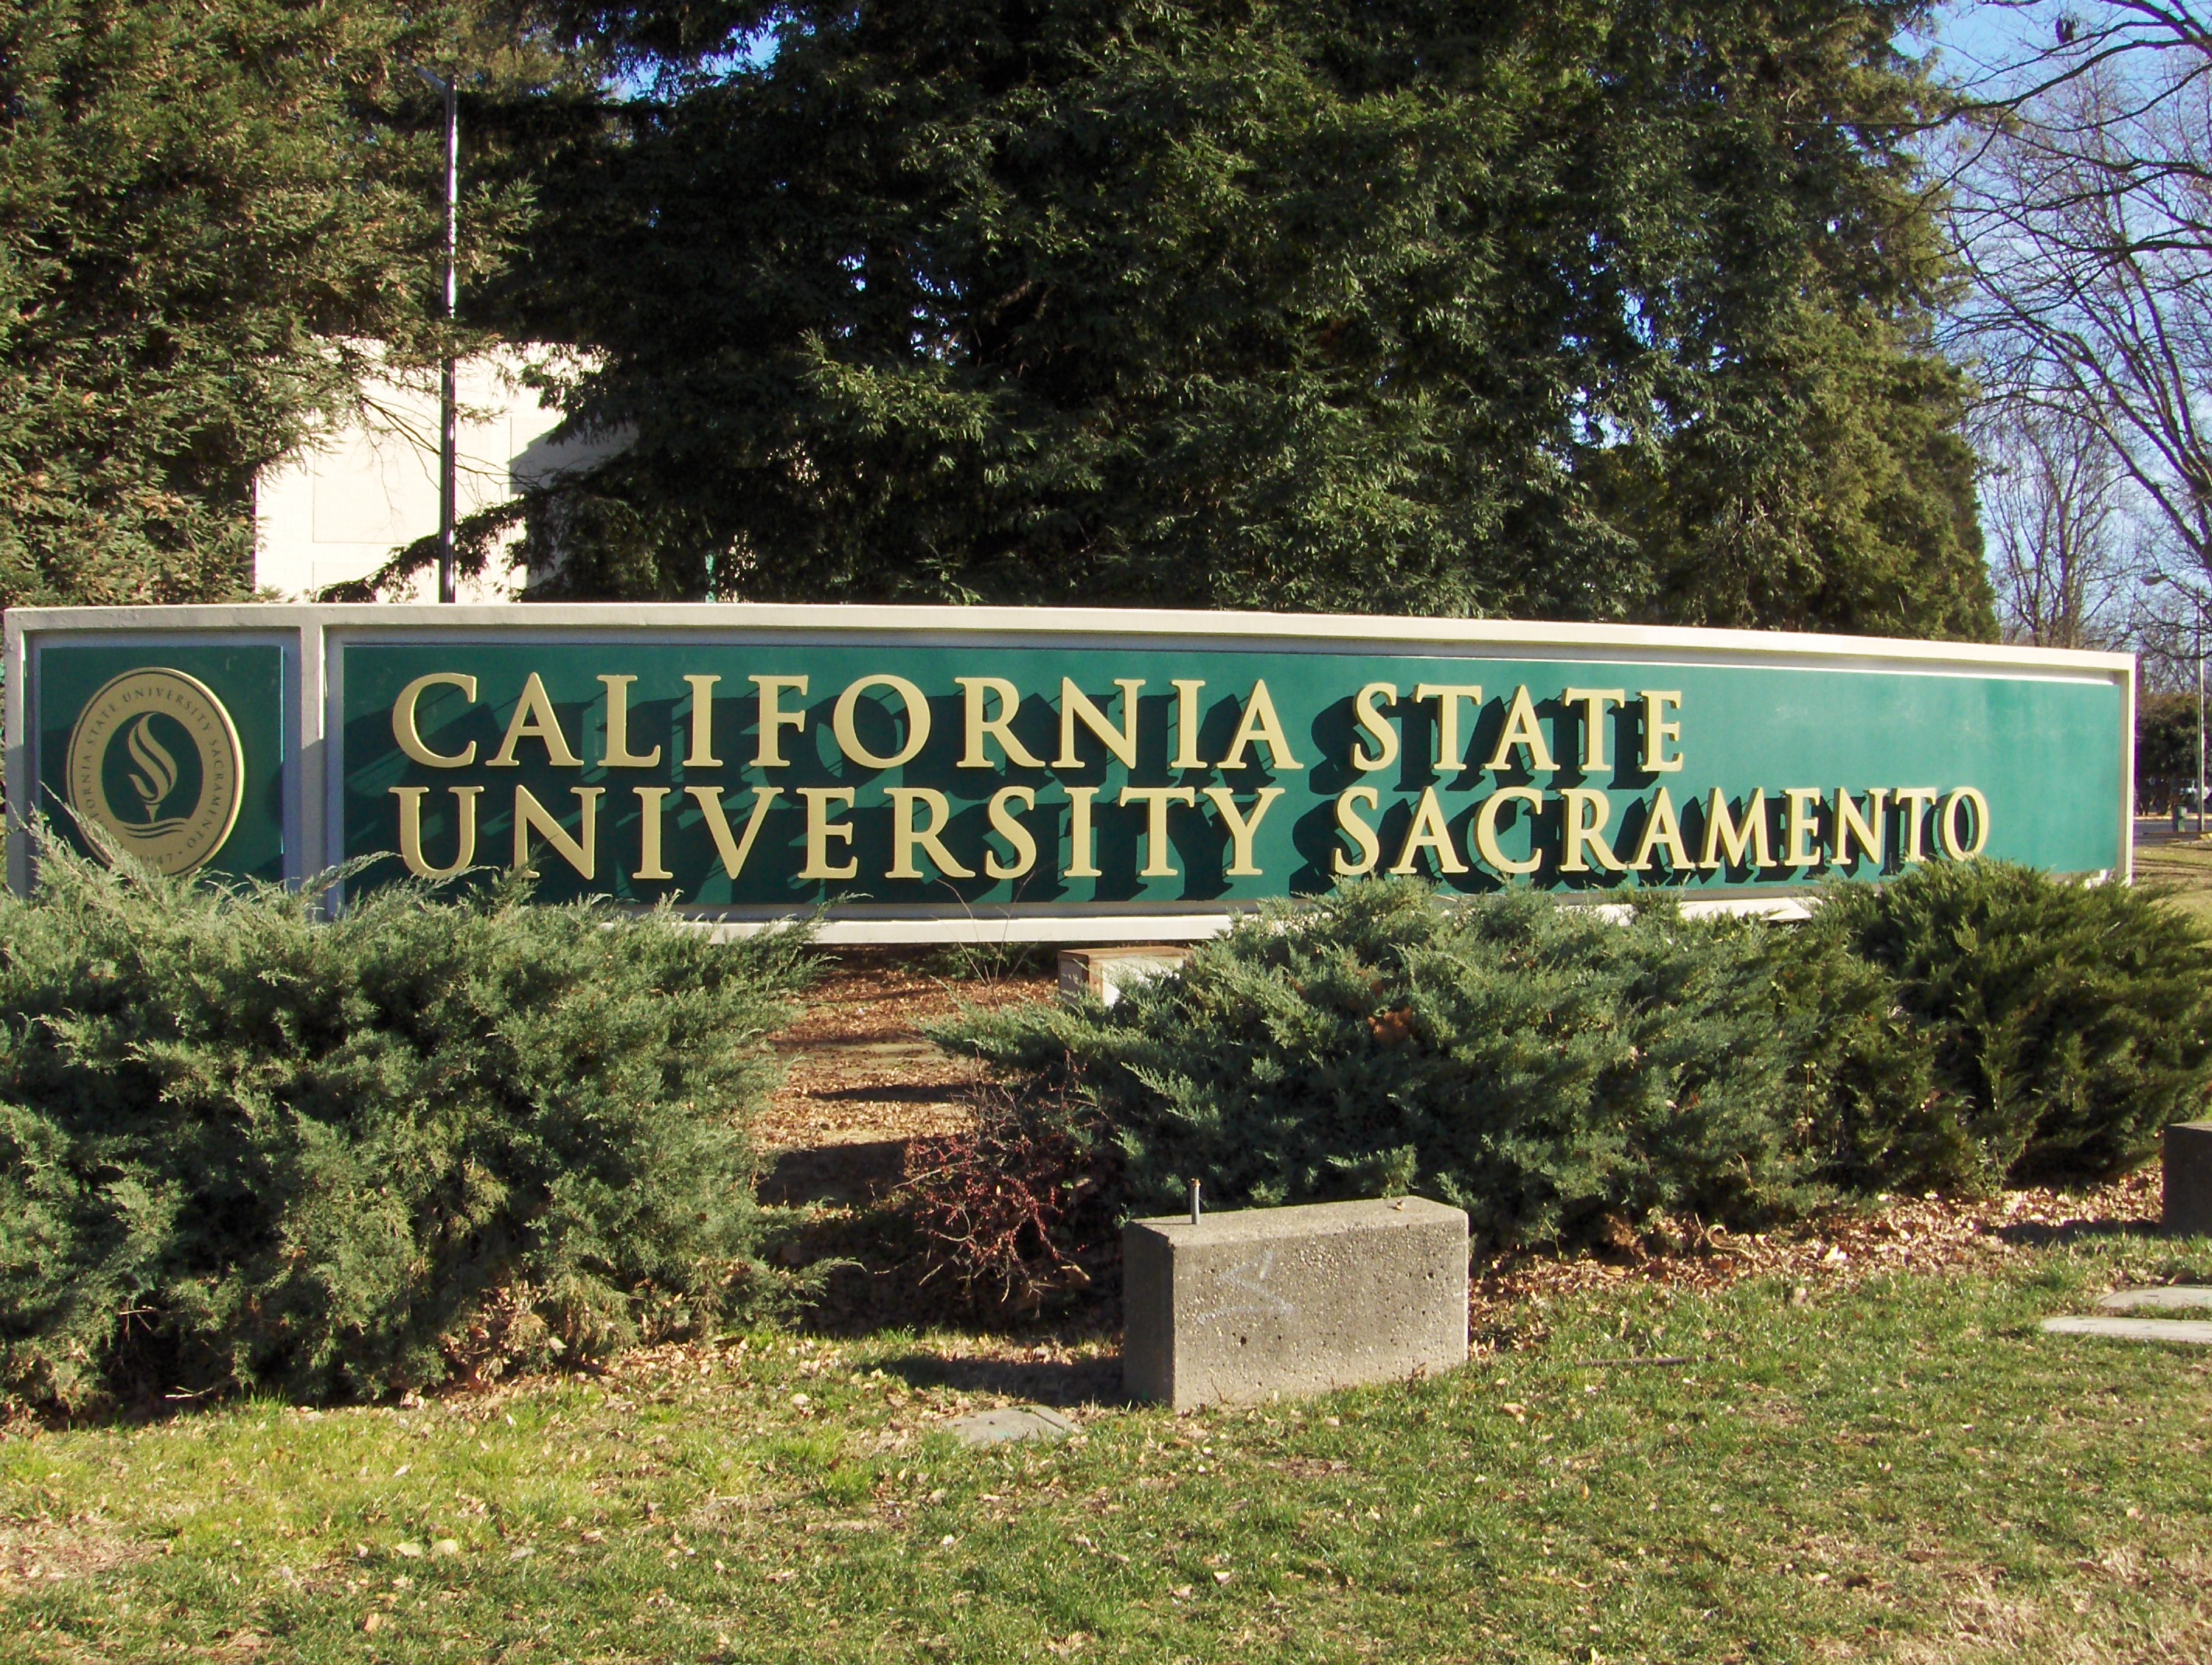

California State University, Sacramento
Sacramento, CA
Competitive athletics, practical majors and capital-city internships give recruits several ways to build their future.


Saint Mary's College of California
Moraga, CA
Personalized teaching and a small-college community pair with demanding coursework and West Coast Conference competition.


University of San Diego
San Diego, CA
Competitive athletics, strong career outcomes and a close-knit campus community give recruits several reasons to consider studying here.
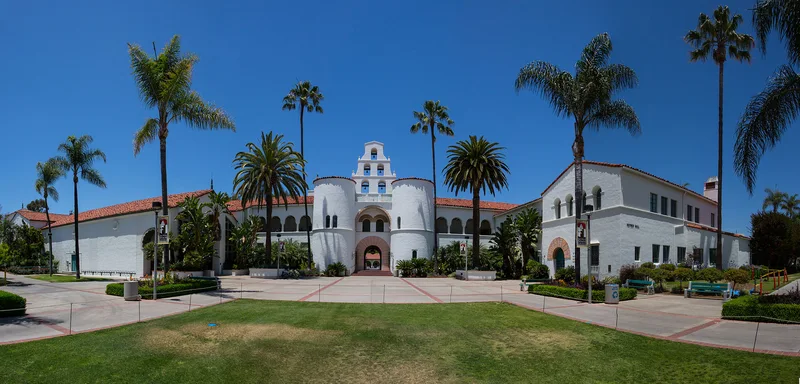

San Diego State University
San Diego, CA
Competitive athletics, regional career connections and an active urban campus give recruits several reasons to consider studying here.


San José State University
San Jose, CA
Career-oriented academics and Mountain West competition attract athletes who want an urban college experience with professional possibilities.
Santa Clara University
Santa Clara, CA
Competitive athletics, approachable faculty and Silicon Valley career opportunities give recruits several reasons to consider this campus.
Roster openings · 2026-27
Which D1 Softball programs have the most roster spots opening up?
Every program ranked by players in their final year, with the positions they are losing.
5.2players leaving per program, on average
See the programs Three ways to start
Where are you in the search?
Pick the option that matches where you are, and we will show you the plan that fits.
Recruiting Plan
Your 20 to 25 best-fit schools, picked for you.



- Starter: the list, fit reads, real costs and a dated timeline
- Complete: adds roster reads and coach emails for every school
$99 or $249Starter or Complete, one time
Build my plan
Roster Report
The roster at your position, at the schools you pick.


- Who is graduating at your position, class year by class year
- Where spots are likely to open, in plain words
From $193, 8 or 15 schools
Choose my schools
School Plan
One school, covered end to end.
- Your honest odds, the roster and the verified coach
- Intro email, three follow-ups, admissions steps and timeline
$49One school, one time
Pick my school Resources