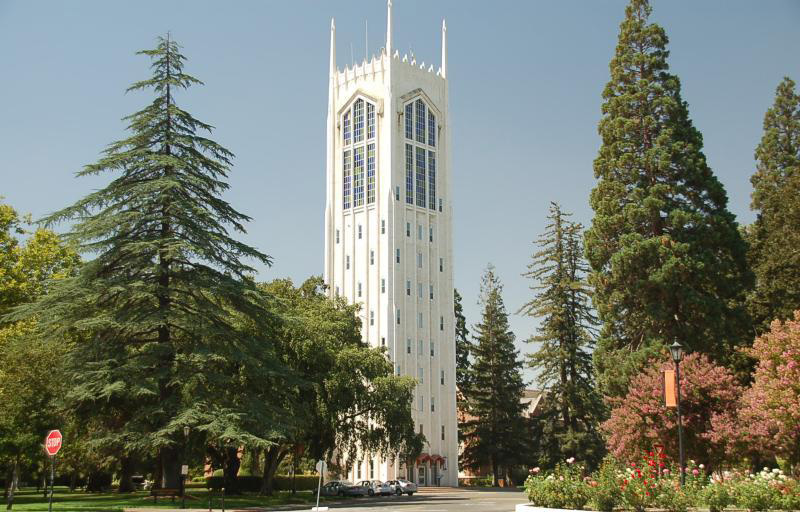

Division I competition, small classes and strong health and professional pathways give athletes clear reasons to consider Pacific.

NCAA Division IWest Coast ConferenceCalifornia

Loyola Marymount University Men's Golf
One plan built for Loyola Marymount University Men's Golf, with the roster read, the coach's contact and a dated plan, delivered within 24 hours. An expert checks every plan.
- 9
- Roster
- 3
- Leaving
- 7%
- In-state
- 11%
- Transfers
Overview
Loyola Marymount University Men's Golf Team Details
Key facts about the Loyola Marymount University men's golf team.
Loyola Marymount University runs a men's golf team in Los Angeles, California, competing in the West Coast Conference at the Division I level. It recruits widely, and no state supplies more than 7% of the roster. Transfers make up 36% of the roster, well above the 21% median among Division I men's golf teams.
NCAA Division IWest Coast ConferenceCalifornia
- Head coach
- Jason D'Amore
- Home venue
- Pauma Valley, CA
- Average roster
- 9
- Win rate, 2017-18
- 100%
Head Coach
players a season
Fit check
Do You Fit at Loyola Marymount University?
Pick your position and level, add a test score if you have one, and get an instant read on your chances here. Free, and no account needed.
Coaching staff
Get on This Staff's Radar
Head coach
Jason D'AmoreHead CoachEmail●●●●●●@●●●●.edu
Phone(●●●) ●●●-●●●●
Roster
Roster Breakdown
The roster by class
2FreshmenFr.
1SophomoresSo.
3JuniorsJr.
3SeniorsSr.
9 players on the latest roster (2026-27).
Roster openings after 2026-27
3players in their final year, 33% of the roster
See who you would be replacing In the top quarter among Division I men's golf teams, 36% of players here came in as transfers, where the median is 21%.
Transfers
Transfers In and Out
1
transfers in for 2026-27
2
transfers out
- Share of the roster
- 11%
- Per 100 freshmen
- 50
- Came from
- 1 from Division III
Footprint
Where This Team Recruits
Where the players are from
27players
In-state7.4%
Other US states29.6%
International63%
Counted from players on recent rosters with a known hometown.
Top home states
California7%
Texas7%
Florida7%
New York4%
Arkansas4%
Geographic reach is wide, with the top five states supplying only 30% of the roster against a 74% median among Division I men's golf teams. A global roster: 63% of players are from abroad, most often from Mexico, compared with a median of 23% among Division I men's golf teams. A national footprint like that means coaches look well beyond the home region.
Results
Loyola Marymount University Men's Golf Recent Results
Swipe to see every season
Latest
2017-18
100%1-0overall
Recruiting
Recruiting Outlook
Who fits this program
- Competes at NCAA Division I West Coast Conference level
- Supports balance of golf training and demanding academics
- Located on medium-sized urban campus with vibrant student life
- Ideal for golfers seeking high-level competition in a city setting
Program stats
The Program by the Numbers
11
Athletes on the roster
2
Coaches on staff
$20,917
Spent per athlete
Spending and revenue a year
Spending$991,150
Revenue$991,150
Revenue covers everything the program spends.
Source: the federal Equity in Athletics report, 2025.
The school
School Environment
Loyola Marymount University combines challenging coursework with particular strength in film, television and business, making academic fit, faculty access and career direction important considerations alongside your athletic goals.
Loyola Marymount UniversityLos Angeles, CaliforniaSee the full profile 45%
Acceptance rate
79%
Graduation rate
- Undergraduates
- 7,273
- Net price a year
- $48,381
- Earnings after ten years
- $78,349
Official links
Official Loyola Marymount University Men's Golf Links
Similar programs
Similar Golf Teams
Programs at a similar level, with similar academics, worth adding to your recruiting list.


Coastal campus life, accessible faculty and competitive athletics appeal to recruits seeking a small, faith-based community.


Strong academics, prominent athletics and in-state affordability give recruits compelling reasons to consider this spirited campus.
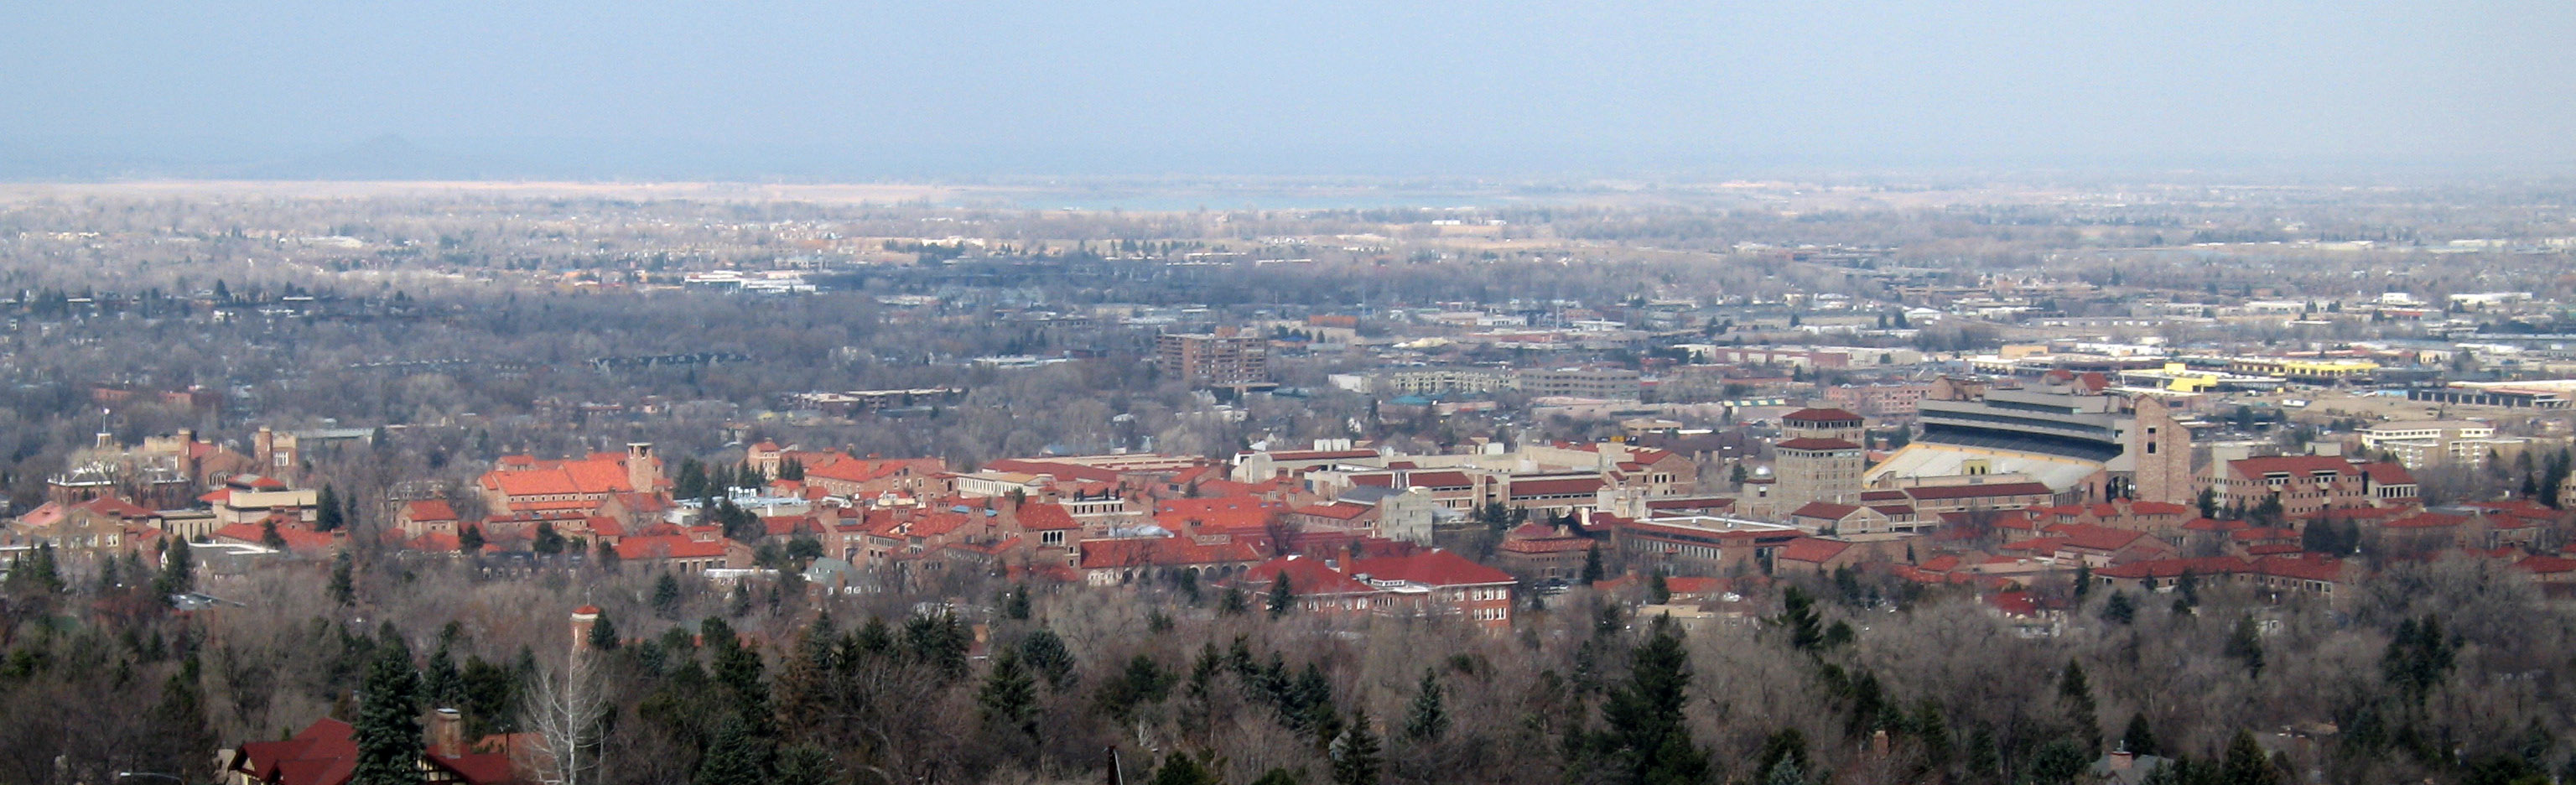

Competitive athletics, research opportunities and an outdoor-focused campus give athletes compelling reasons to consider life in Boulder.


Virginia Polytechnic Institute and State University
Blacksburg, VA
Why it is similar: Similar level and academics.ACC competition, strong technical academics and a spirited residential community give athletes compelling reasons to consider Blacksburg.


Competitive athletics, established academic programs and a faith-centered community appeal to athletes seeking structure and value.
Teams in California
More Golf Teams in California


California Polytechnic State University
San Luis Obispo, CA
Applied learning, competitive athletics and strong career outcomes appeal to recruits who take academics seriously.


California State University, Fullerton
Fullerton, CA
Competitive athletics, career-focused study and affordable options attract athletes who want a broad university experience.
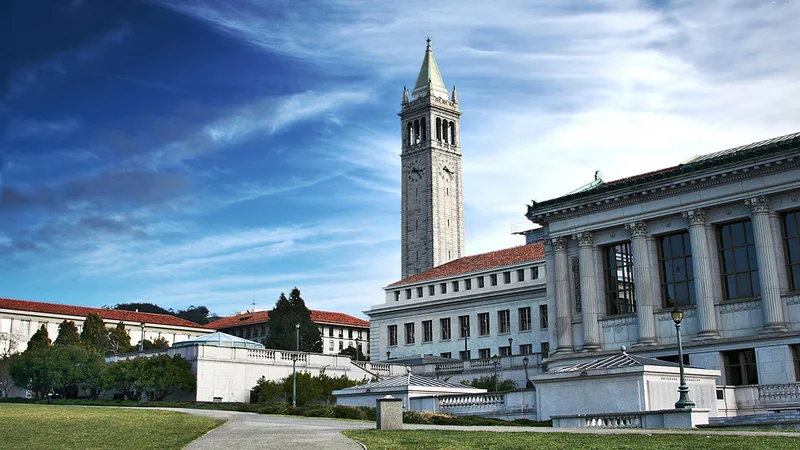

University of California, Berkeley
Berkeley, CA
Demanding academics, competitive athletics and Bay Area career opportunities appeal to athletes with ambitious goals beyond their sport.
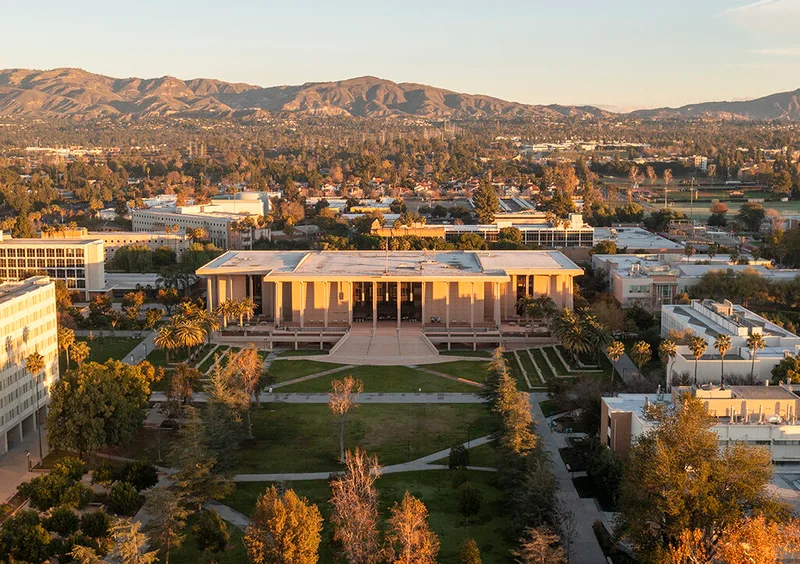

California State University, Northridge
Los Angeles, CA
Accessible admissions, affordable costs and Los Angeles career connections complement the demands of Division I competition.
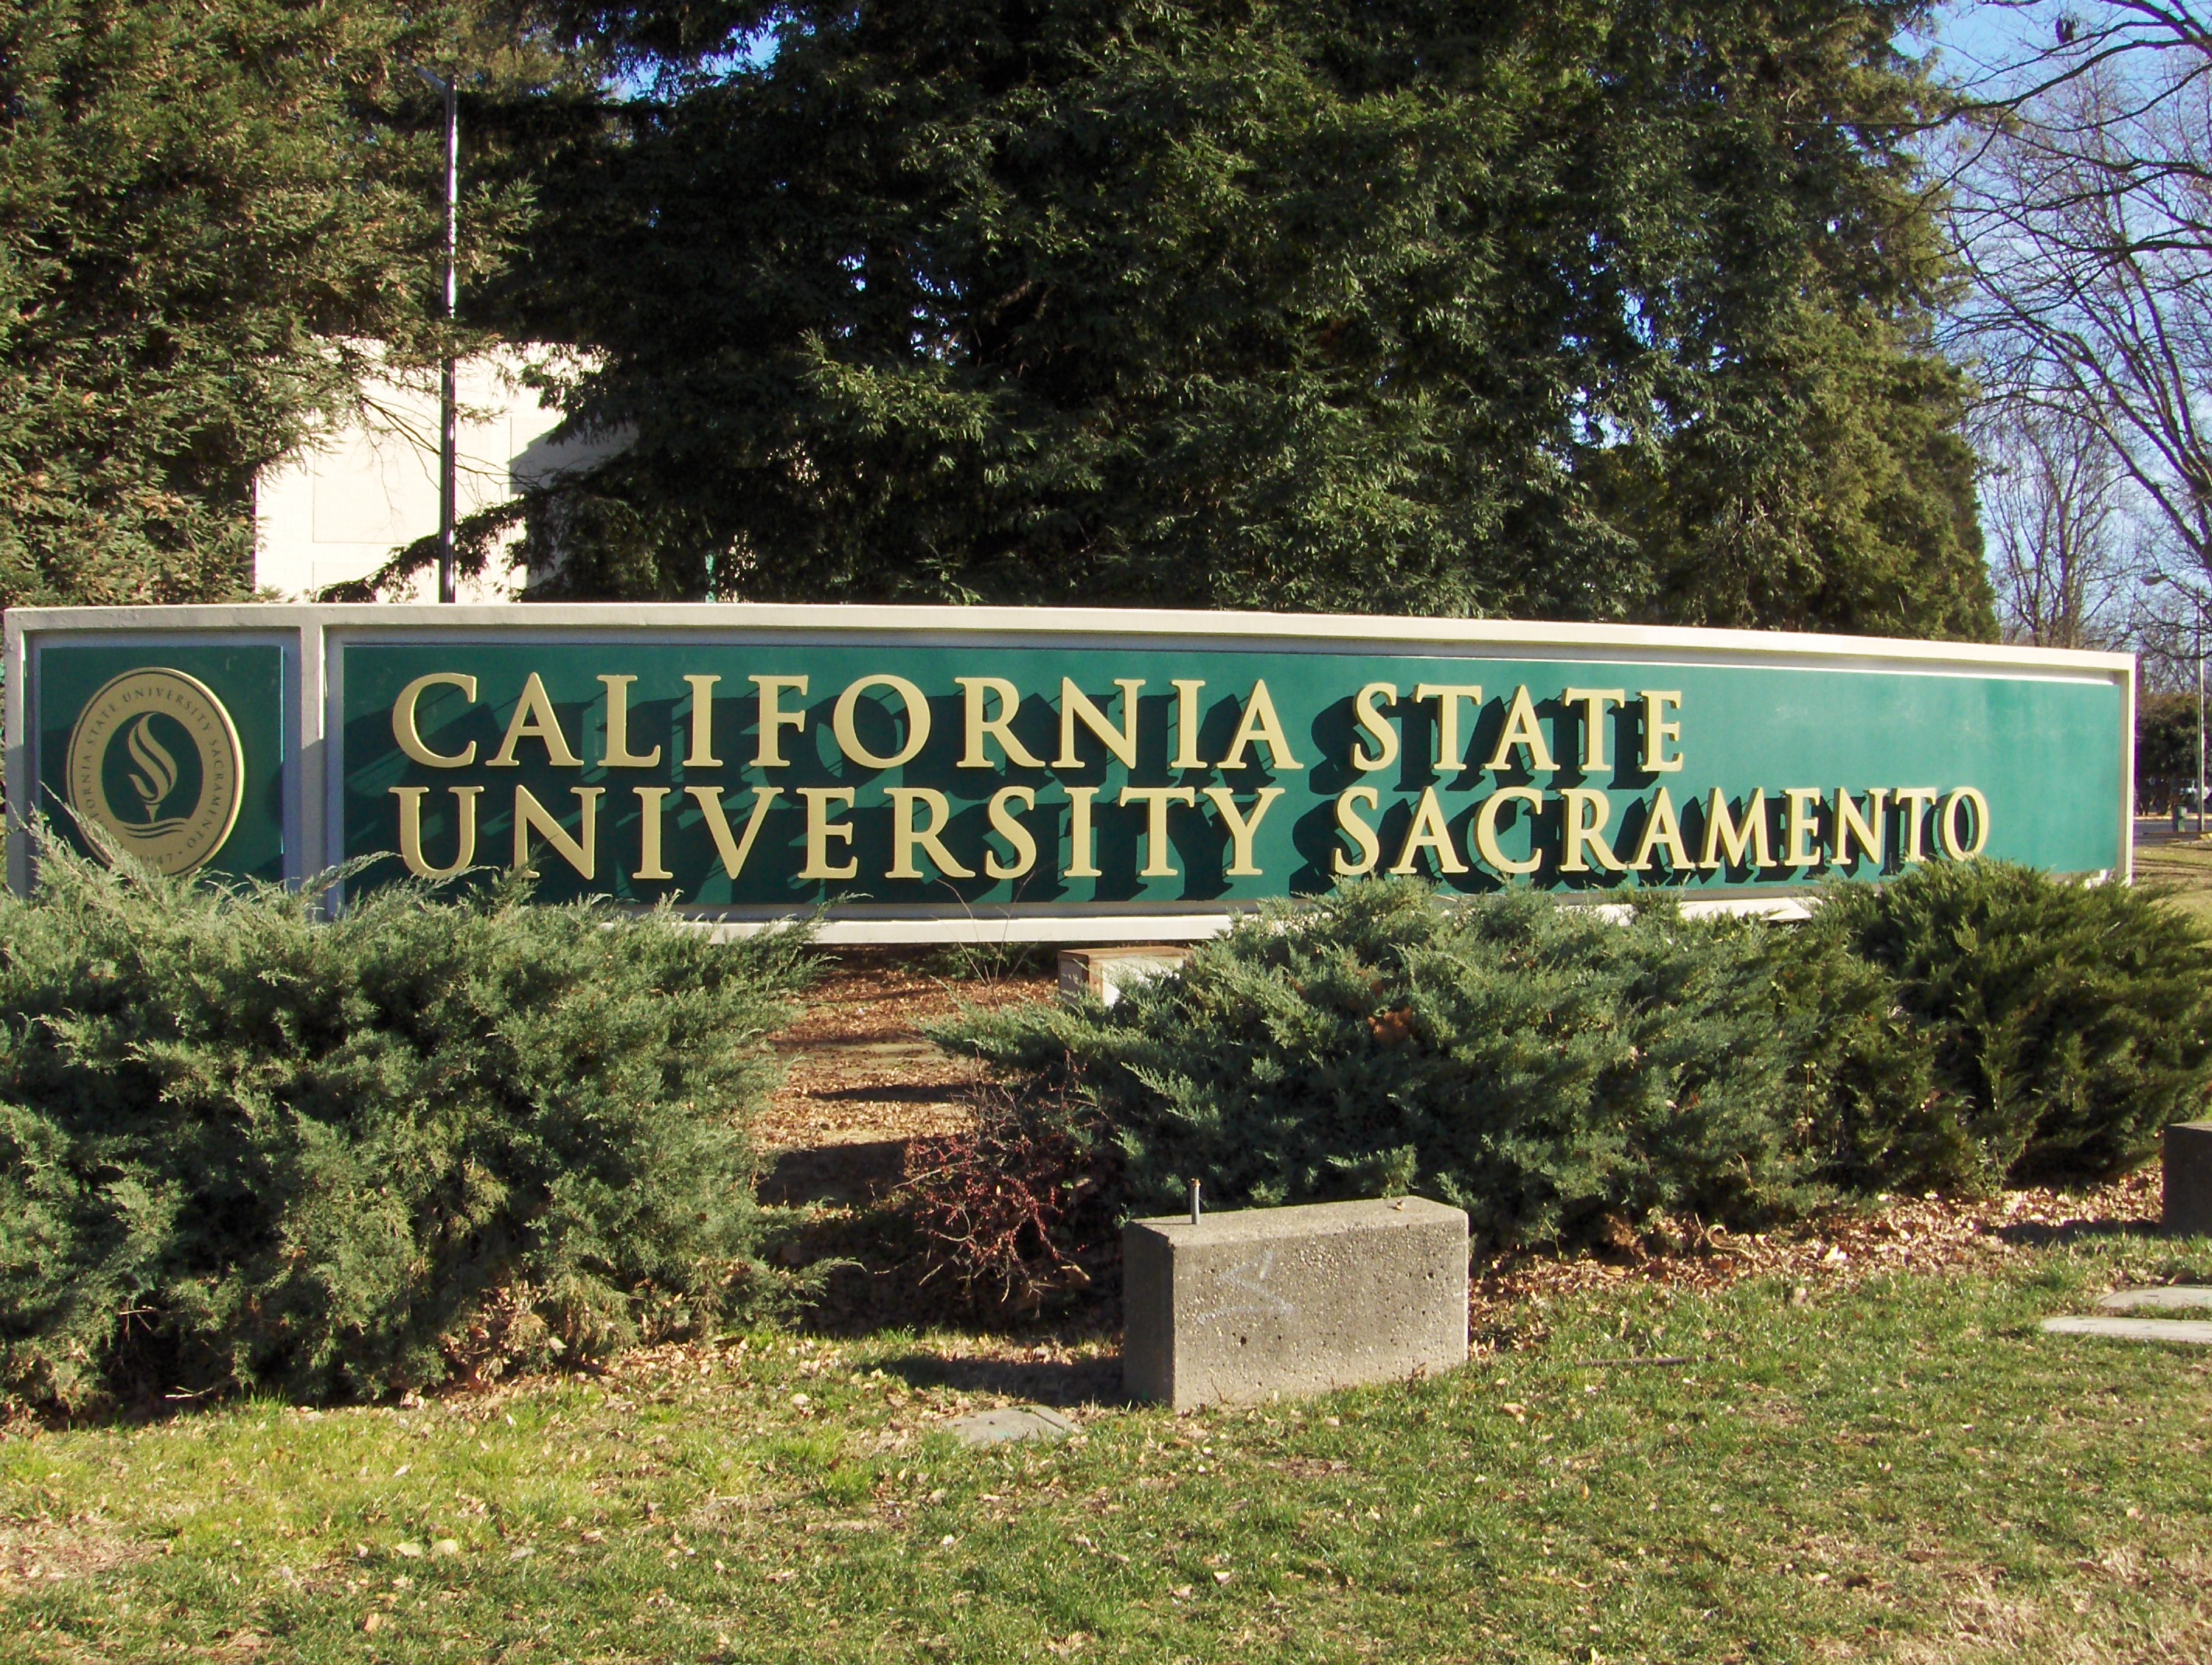

California State University, Sacramento
Sacramento, CA
Competitive athletics, practical majors and capital-city internships give recruits several ways to build their future.


Saint Mary's College of California
Moraga, CA
Personalized teaching and a small-college community pair with demanding coursework and West Coast Conference competition.


University of San Diego
San Diego, CA
Competitive athletics, strong career outcomes and a close-knit campus community give recruits several reasons to consider studying here.
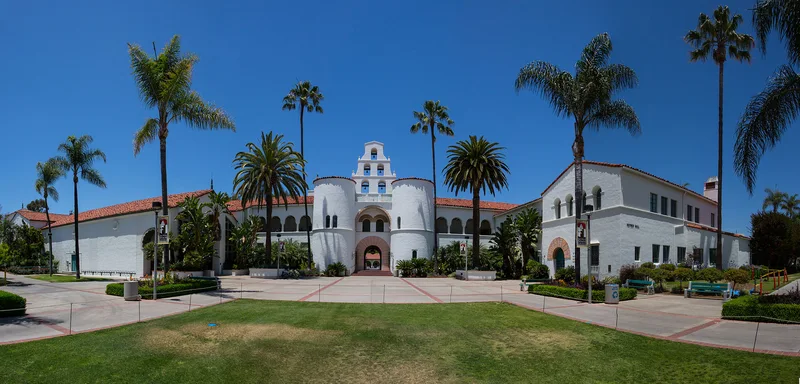

San Diego State University
San Diego, CA
Competitive athletics, regional career connections and an active urban campus give recruits several reasons to consider studying here.


University of San Francisco
San Francisco, CA
Competitive athletics, career-focused academics and an urban Jesuit mission give recruits distinct reasons to consider studying here.


San José State University
San Jose, CA
Career-oriented academics and Mountain West competition attract athletes who want an urban college experience with professional possibilities.


Santa Clara University
Santa Clara, CA
Competitive athletics, approachable faculty and Silicon Valley career opportunities give recruits several reasons to consider this campus.
Roster openings · 2026-27
Which D1 Men's Golf programs have the most roster spots opening up?
Every program ranked by players in their final year, with the positions they are losing.
2.2players leaving per program, on average
See the programs Three ways to start
Where are you in the search?
Pick the option that matches where you are, and we will show you the plan that fits.
Recruiting Plan
Your 20 to 25 best-fit schools, picked for you.



- Starter: the list, fit reads, real costs and a dated timeline
- Complete: adds roster reads and coach emails for every school
$99 or $249Starter or Complete, one time
Build my plan
Roster Report
The roster at your position, at the schools you pick.


- Who is graduating at your position, class year by class year
- Where spots are likely to open, in plain words
From $193, 8 or 15 schools
Choose my schools
School Plan
One school, covered end to end.
- Your honest odds, the roster and the verified coach
- Intro email, three follow-ups, admissions steps and timeline
$49One school, one time
Pick my school Resources