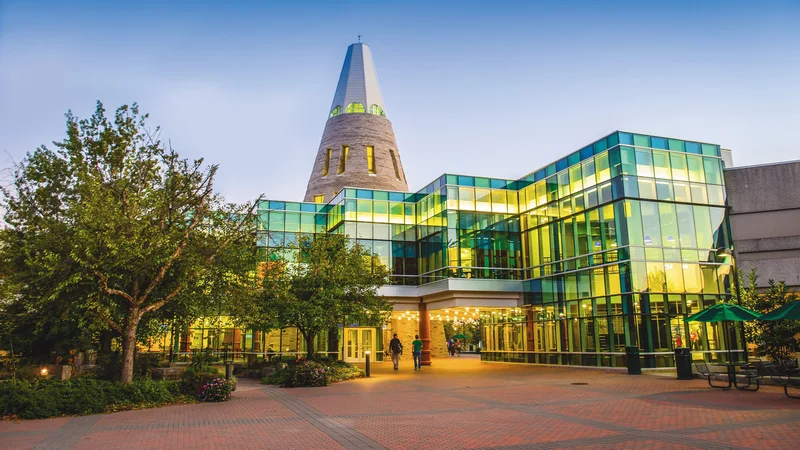

Accessible admissions, teaching-focused faculty and relatively affordable costs give athletes practical reasons to consider competing here.

NCAA Division IOhio Valley ConferenceMissouri

Lindenwood University Men's Basketball
One plan built for Lindenwood University Men's Basketball, with the roster read, the coach's contact and a dated plan, delivered within 24 hours. An expert checks every plan.
- 15
- Roster
- 3
- Leaving
- 33%
- In-state
- 33%
- Transfers
Overview
Lindenwood University Men's Basketball Team Details
Key facts about the Lindenwood University men's basketball team.
From its campus in St. Charles, Missouri, Lindenwood University competes in Division I men's basketball as a member of the Ohio Valley Conference. Its best record in five seasons, 18-15, came in 2025-26. It spends roughly $12,000 per athlete on operations in the 2025 EADA report, about a quarter of the Division I median.
NCAA Division IOhio Valley ConferenceMissouri
- Head coach
- Kyle Gerdeman
- Home venue
- Robert F. Hyland Arena
- Average roster
- 15
- Five-year win rate
- 42%
Men's Basketball Head Coach
players a season
Fit check
Do You Fit at Lindenwood University?
Pick your position and level, add a test score if you have one, and get an instant read on your chances here. Free, and no account needed.
Coaching staff
Get on This Staff's Radar
Head coach
Kyle GerdemanMen's Basketball Head CoachEmail●●●●●●@●●●●.edu
Phone(●●●) ●●●-●●●●
Roster
Roster Breakdown
The roster by class
5FreshmenFr.
3SophomoresSo.
4JuniorsJr.
3SeniorsSr.
15 players on the latest roster (2026-27).
Roster openings after 2026-27
3players in their final year, 20% of the roster
Guard 2 · Forward 1
See who you would be replacingExperienced newcomers are part of the mix, with seven players on the current roster arriving from other colleges, four of them from Division I programs.
Positions
Men's Basketball Roster by Position
How many players a season the program carries at each position, and how tall they are.
Guard
10players a season
Average height 6'3"
Forward
3.7players a season
Average height 6'8"
Center
1.3players a season
Average height 6'10"
Forwards are a smaller part of this roster than usual, at 25% against 35% for the typical Division I men's basketball team.
Transfers
Transfers In and Out
5
transfers in for 2026-27
7
transfers out
- Share of the roster
- 33%
- Per 100 freshmen
- 100
- By position
- Guard 3 · Forward 2
- Came from
- 5 from Division I
Footprint
Where This Team Recruits
Where the players are from
45players
In-state33.3%
Other US states48.9%
International17.8%
Counted from players on recent rosters with a known hometown.
Top home states
Missouri33%
Illinois13%
California9%
Kansas4%
Maryland4%
Players from Missouri fill 33% of the roster, which makes this one of the more local programs among Division I men's basketball teams. For players in Missouri, that is a reason to get on the coaches' radar early.
Results
Lindenwood University Men's Basketball Recent Results
Swipe to see every season
2021-22
41%12-17overall
8-12conference
2022-23
34%11-21overall
6-12conference
2023-24
29%9-22overall
3-15conference
2024-25
48%16-17overall
10-10conference
Best season
2025-26
55%18-15overall
11-9conference
An 18-15 mark in 2025-26, good for 55%, topped every other year of the last five, when the next best win rate was 48%. By contrast, placing in the bottom quarter among Division I men's basketball teams, the team has a 42% win rate over five seasons, behind a 51% median.
Schedule and travel
Men's Basketball Schedule
The season's games, home and away, and how far the team travels.
Recruiting
Recruiting Outlook
Lindenwood competes at the NCAA Division I level in the Ohio Valley Conference, so the recruiting standard is significantly higher than Division II or NAIA basketball. The program has shown recent competitive progress and uses a roster model that includes transfers and developing underclassmen, creating opportunities for players who can contribute in defined roles.
NCAA Division I Ohio Valley Conference programRecent winning season and competitive conference recordTransfer-heavy roster with guard, wing, and frontcourt needs
Recruiting difficulty
60/ 100Hard
OpenCompetitiveSelectiveElite
It is a competitive Division I program where most roster spots require proven college-level ability, but it is not currently positioned as an elite national contender.
What coaches value
- Reliable guards who can handle pressure, make quick decisions, and protect the ball
- Consistent perimeter shooting combined with the ability to defend multiple positions
- Physical frontcourt players who rebound, protect the rim, and finish efficiently
- Players who accept defined roles, compete defensively, and adapt quickly to Division I pace
How to get recruited here
Build verified film that shows decision-making, shooting, defensive effort, and production against strong competition. Contact the staff with a concise athletic profile, academic information, schedule, video, and relevant statistics, then pursue exposure through high-level high school, prep, junior college, or transfer competition.
How hard is it to make the team
Making the team is difficult because Lindenwood competes in NCAA Division I basketball and faces conference-level athletes with significant recruiting and college experience. Recruits should expect competition from scholarship-level high school players, transfers, junior college athletes, and returning players, so a clear positional role and dependable skills are important.
Who fits this program
- Basketball players seeking a competitive NCAA Division I pathway
- Players ready to balance college coursework with Division I demands
- Athletes preferring a small residential campus in an urban setting
- Players suited to defined roles within a developing roster
Videos
Lindenwood University Men's Basketball Videos
Program stats
The Program by the Numbers
16
Athletes on the roster
5
Coaches on staff
$15,374
Spent per athlete
Spending and revenue a year
Spending$1,241,973
Revenue$1,241,973
Revenue covers everything the program spends.
According to the 2025 EADA report, the program spends roughly $12,000 per athlete on operations, about a quarter of the Division I median.
Source: the federal Equity in Athletics report, 2025.
Feeders
Top Feeder Schools and Clubs
The high schools and clubs that sent the most players to this roster.
1Cardinal Ritter High School2 players on recent rosters
2Quincy Sr High School2 players on recent rosters
3Sunrise Christian Academy2 players on recent rosters
At least two players apiece have come from three schools or clubs, and that group includes Cardinal Ritter High School.
The school
School Environment
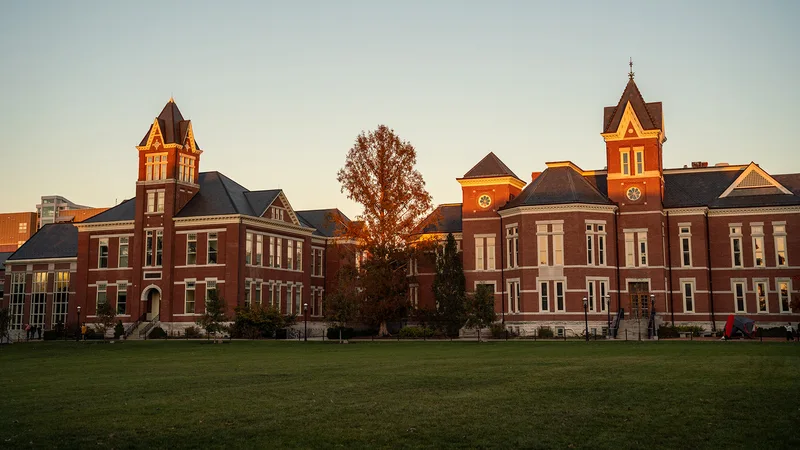
Lindenwood University emphasizes professional preparation through business, education, health sciences and fine arts, with experiential learning and internships helping you connect classroom work to career goals while pursuing your sport.
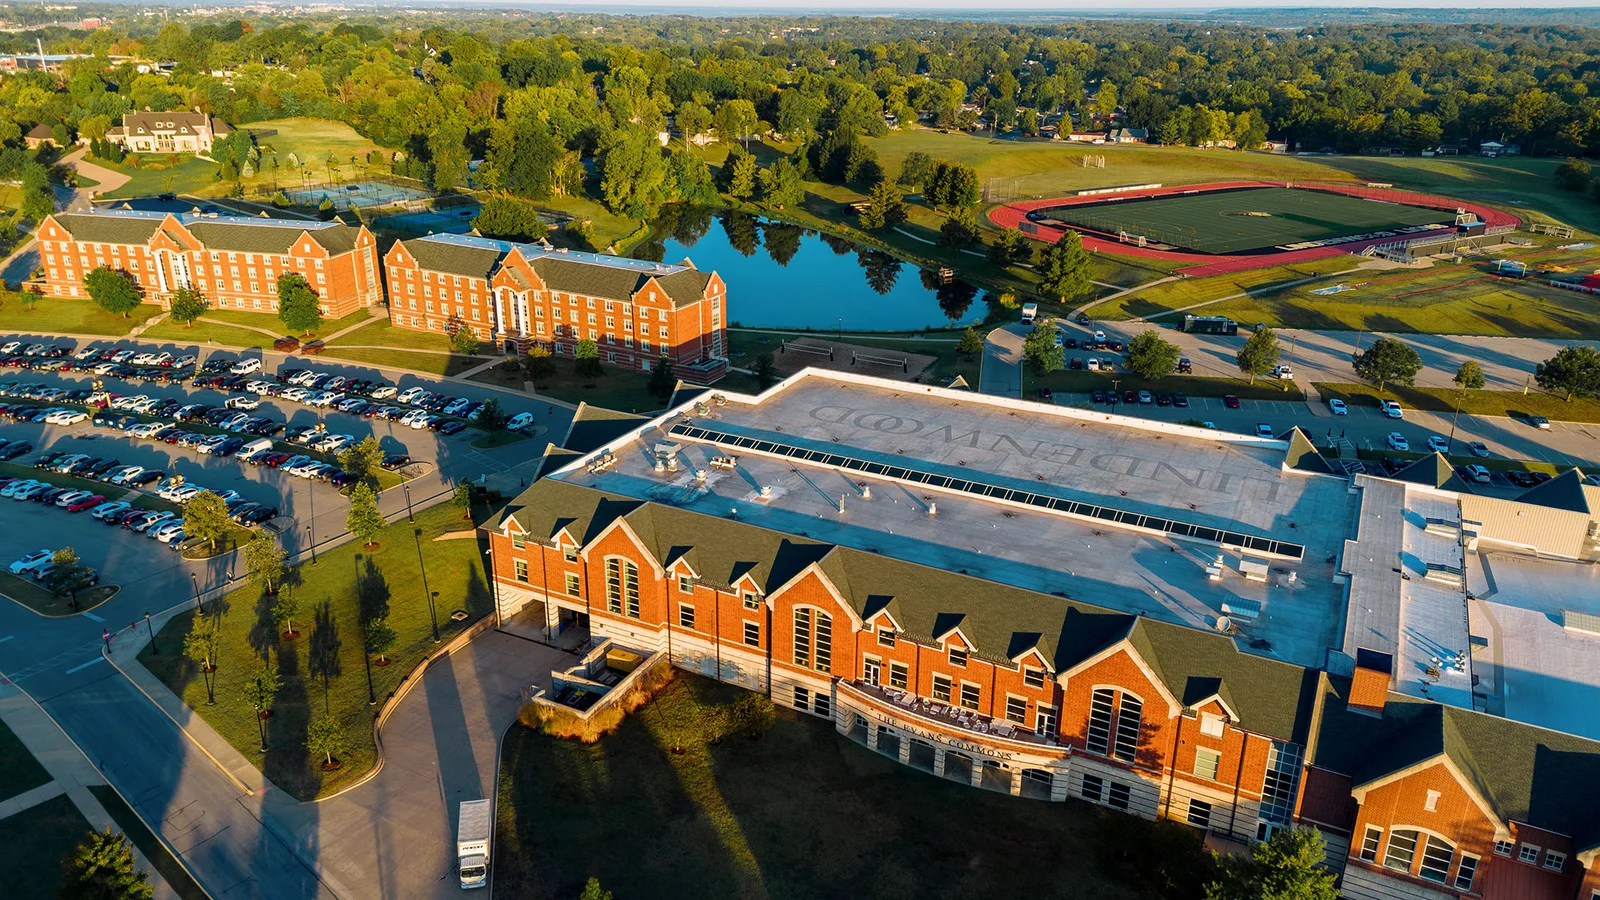 Lindenwood UniversitySt. Charles, MissouriSee the full profile
57%
Acceptance rate
49%
Graduation rate
- Undergraduates
- 4,663
- Net price a year
- $19,638
- Earnings after ten years
- $53,278
Official links
Official Lindenwood University Men's Basketball Links
Similar programs
Similar Basketball Teams
Programs at a similar level, with similar academics, worth adding to your recruiting list.


Division I competition, career-focused academics and Kansas City connections give athletes several reasons to consider studying here.


Division I competition, affordable tuition and a close small-town campus give athletes practical reasons to consider UT Martin.


Personal faculty connections and Division I competition give athletes a small-campus experience without stepping away from competitive sports.
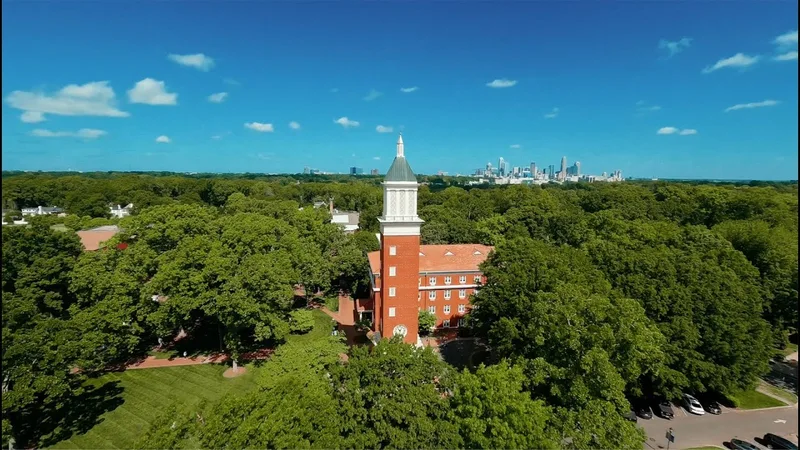

A small campus, demanding competition and career-focused academics give athletes a distinctive balance in Charlotte.


Christian community, reachable faculty and Division I competition appeal to athletes seeking connection beyond their sport.
Teams in Missouri
More Basketball Teams in Missouri
University of Missouri-Kansas City
Kansas City, MO
Division I competition, career-focused academics and Kansas City connections give athletes several reasons to consider studying here.

Missouri State University
Springfield, MO
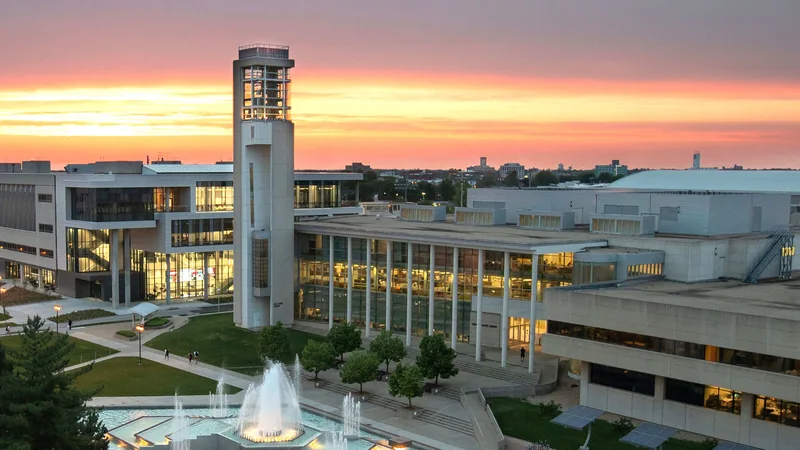
Competitive athletics, broad academic options and relatively affordable tuition give recruits several reasons to consider this campus.


Saint Louis University
St. Louis, MO
Competitive athletics, health-focused academics and a service-minded urban community give recruits several reasons to consider this campus.


Southeast Missouri State University
Cape Girardeau, MO
Division I competition, practical academics and relatively affordable tuition appeal to athletes seeking a residential college experience.

University of Missouri
Columbia, MO
SEC competition, recognized academic strengths and a lively residential campus give athletes several reasons to consider Missouri.
Roster openings · 2026-27
Which D1 Men's Basketball programs have the most roster spots opening up?
Every program ranked by players in their final year, with the positions they are losing.
4.3players leaving per program, on average
See the programs Three ways to start
Where are you in the search?
Pick the option that matches where you are, and we will show you the plan that fits.
Recruiting Plan
Your 20 to 25 best-fit schools, picked for you.



- Starter: the list, fit reads, real costs and a dated timeline
- Complete: adds roster reads and coach emails for every school
$99 or $249Starter or Complete, one time
Build my plan
Roster Report
The roster at your position, at the schools you pick.


- Who is graduating at your position, class year by class year
- Where spots are likely to open, in plain words
From $193, 8 or 15 schools
Choose my schools
School Plan
One school, covered end to end.
- Your honest odds, the roster and the verified coach
- Intro email, three follow-ups, admissions steps and timeline
$49One school, one time
Pick my school Resources
Additional Resources
Pathley Basketball hubRankings, divisions and programsBasketball recruiting timelineWhat to do each year of high schoolHow coaches evaluate college basketballWhat coaches look for at this levelThe basketball recruiting guideContact rules, emails and costsEvery D1 Men's Basketball programThe full list, with filters