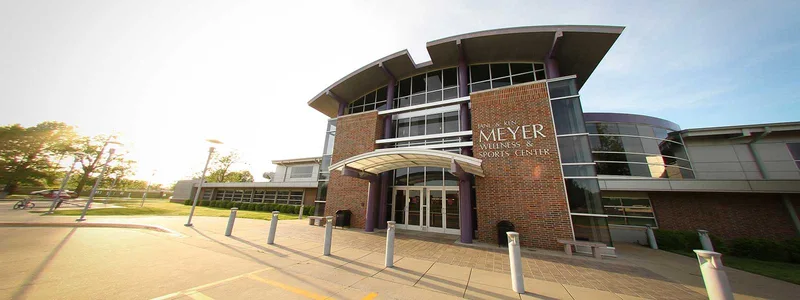

Faith-centered campus life and personal faculty attention give athletes a close-knit setting for study and competition.
NCAA Division IIGreat Lakes Valley ConferenceMissouri

Lincoln University of Missouri Baseball
One plan built for Lincoln University of Missouri Baseball, with the roster read, the coach's contact and a dated plan, delivered within 24 hours. An expert checks every plan.
- 43
- Roster
- 2
- Leaving
- 64%
- In-state
- 2%
- Transfers
Overview
Lincoln University of Missouri Baseball Team Details
Key facts about the Lincoln University of Missouri baseball team.
Lincoln University of Missouri runs a baseball team in Jefferson City, Missouri, competing in the Great Lakes Valley Conference at the Division II level. Only 59% of last season's non-seniors returned, which marks high turnover among Division II baseball teams. It loses just two players after the 2026-27 season, so room for the Class of 2027 is limited.
NCAA Division IIGreat Lakes Valley ConferenceMissouri
- Head coach
- Grant Reynolds
- Home venue
- Vivion Field
- Average roster
- 37
- Five-year win rate
- 8%
Head Baseball Coach
players a season
Fit check
Do You Fit at Lincoln University of Missouri?
Pick your position and level, add a test score if you have one, and get an instant read on your chances here. Free, and no account needed.
Coaching staff
Get on This Staff's Radar
Head coach
Grant ReynoldsHead Baseball CoachEmail●●●●●●@●●●●.edu
Phone(●●●) ●●●-●●●●
Roster
Roster Breakdown
The roster by class
14FreshmenFr.
16SophomoresSo.
11JuniorsJr.
2SeniorsSr.
43 players on the latest roster (2027).
Roster openings after 2026-27
2players in their final year, 5% of the roster
Infielder 2
Few players are set to leave after the 2026-27 season, only two players and 5% of the roster, which makes the room for the Class of 2027 tighter than most among Division II baseball teams.
See who you would be replacingRoster churn is a theme here, with 59% of last season's freshmen, sophomores and juniors returning against a 72% median among Division II baseball teams. Transfers make up just 23% of the roster, in the bottom quarter among Division II baseball teams, where the median is 34%. High turnover can mean more openings for new players.
Positions
Baseball Roster by Position
How many players a season the program carries at each position, and how tall they are.
Pitcher
13players a season
Average height 6'1"
Catcher
4players a season
Average height 6'0"
Infielder
9.7players a season
Average height 6'0"
Outfielder
7players a season
Average height 5'11"
Utility/Designated Hitter
3players a season
Average height 6'0"
Utility players and designated hitters are a larger part of this roster than usual, at 8% against 4% for the typical Division II baseball team.
Transfers
Transfers In and Out
1
transfers in for 2026-27
0
transfers out
- Share of the roster
- 2%
- Per 100 freshmen
- 7
- By position
- Pitcher 1
- Came from
- 1 from NAIA
Footprint
Where This Team Recruits
Where the players are from
110players
In-state63.6%
Other US states28.2%
International8.2%
Counted from players on recent rosters with a known hometown.
Top home states
Missouri64%
Texas6%
Oklahoma5%
Florida4%
Arizona3%
With the five largest states adding up to only 81% of the roster, the staff recruits more broadly than most among Division II baseball teams. Coaches here recruit well beyond one region, so location is less of a barrier for recruits.
Results
Lincoln University of Missouri Baseball Recent Results
Swipe to see every season
2014
5%2-41overall
0-36conference
2015
6%3-47overall
1-31conference
2016
2%1-49overall
0-39conference
2025
13%6-42overall
4-28conference
Best season
2026
15%7-41overall
1-31conference
This team has an 8% winning percentage over the last five seasons, which falls in the bottom 10% among Division II baseball teams, where the median is 51%. This team won seven wins in the 2026 season, its best winning percentage in five seasons, though the record was 7-41.
Standings
Great Lakes Valley Conference Standings
Where Lincoln University of Missouri stands in the Great Lakes Valley Conference.
Schedule and travel
Baseball Schedule
The season's games, home and away, and how far the team travels.
Recruiting
Recruiting Outlook
Who fits this program
- Competes in NCAA Division II Great Lakes Valley Conference baseball
- Balances baseball commitments with accessible academics and smaller classes
- Located on a compact urban campus fostering a connected lifestyle
- Suited for baseball players seeking a growth-focused environment
Program stats
The Program by the Numbers
25
Athletes on the roster
3
Coaches on staff
Spending and revenue a year
Spending$436,941
Revenue$436,941
Revenue covers everything the program spends.
Coaches are responsible for fewer athletes than usual, with about eight athletes per coach in the 2025 EADA report against a median of 13 among Division II baseball teams. The operating budget is above its peers: about $5,000 per athlete in the same report, about 59% above the Division II median.
Source: the federal Equity in Athletics report, 2025.
The school
School Environment
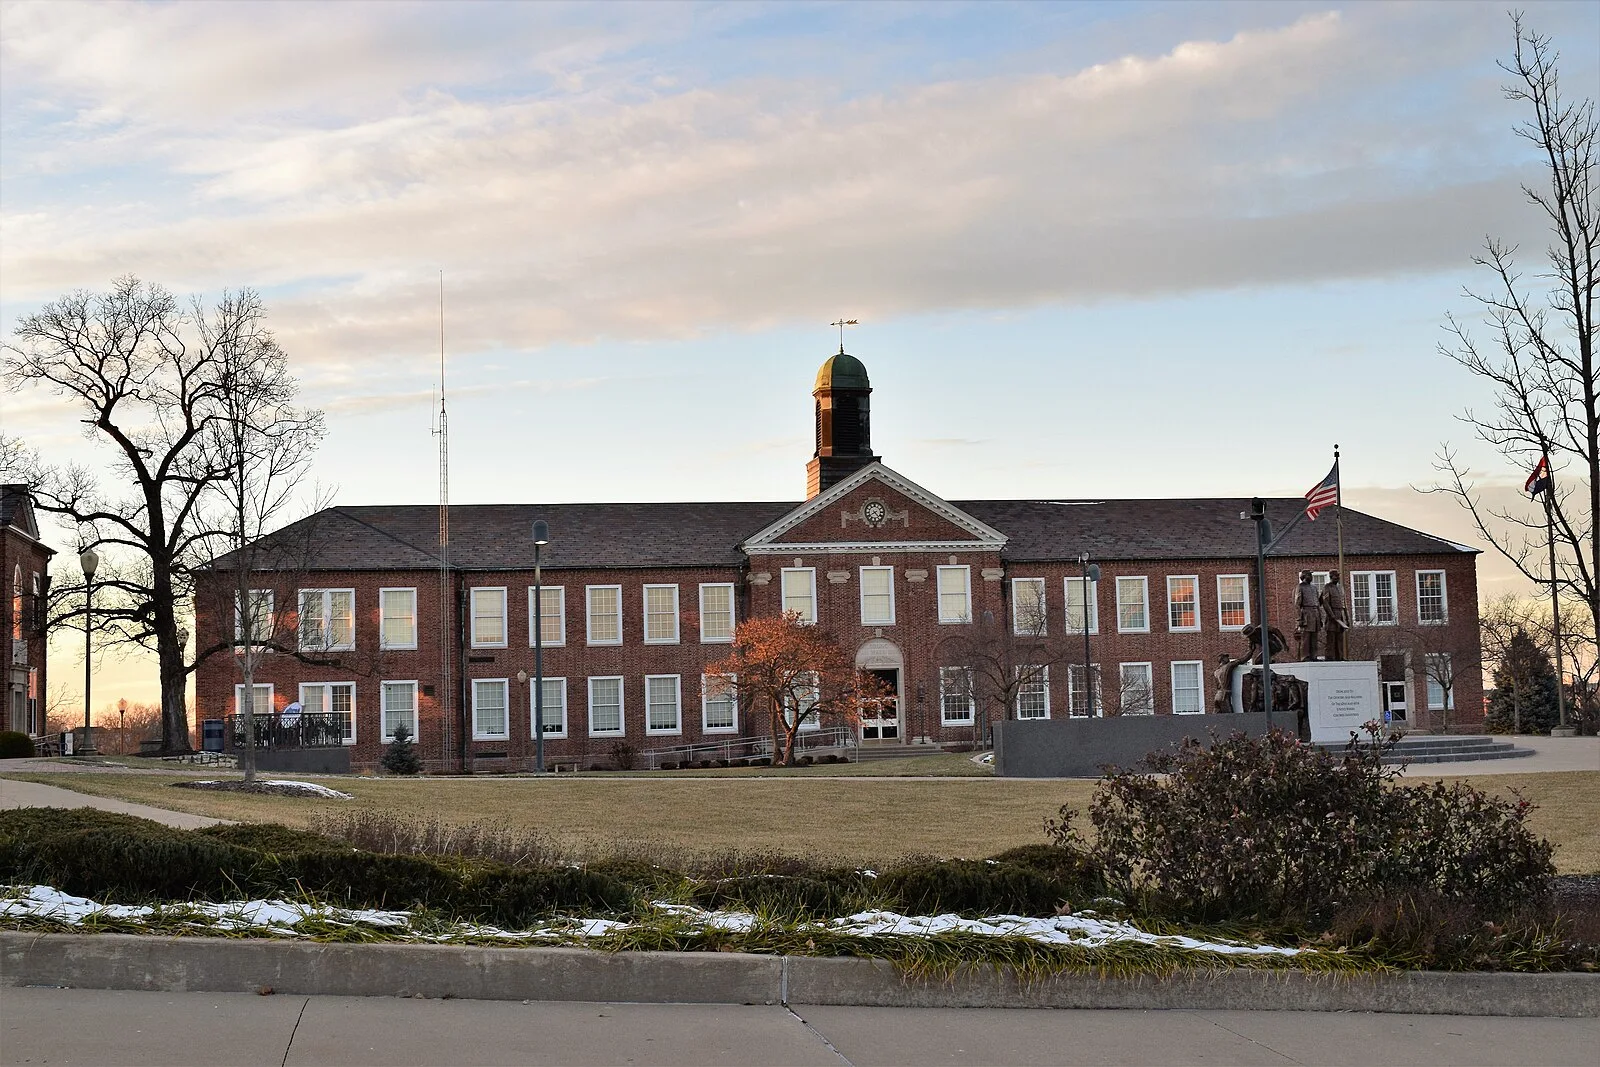
Lincoln University of Missouri pairs its land-grant mission with applied academics, offering a useful starting point for comparing admissions expectations, coursework, popular majors, faculty access and career outcomes.
Lincoln University of MissouriJefferson City, MissouriSee the full profile 61%
Acceptance rate
21%
Graduation rate
- Undergraduates
- 1,926
- Net price a year
- $19,092
- Earnings after ten years
- $39,463
Official links
Official Lincoln University of Missouri Baseball Links
Similar programs
Similar Baseball Teams
Programs at a similar level, with similar academics, worth adding to your recruiting list.


Close faculty connections, undergraduate research and affordable tuition appeal to athletes seeking a small-campus experience.


Close mentoring, academic support and a scenic rural setting complement competitive athletics and available financial aid.


A close-knit HBCU community, approachable faculty and CIAA competition give athletes reasons to consider this campus.
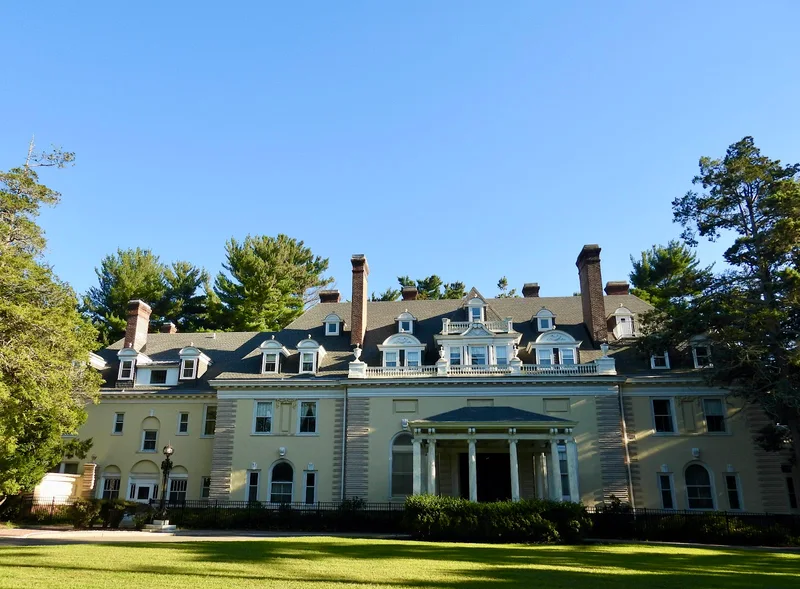

A close-knit campus, reachable faculty and conference competition appeal to athletes seeking a personal college experience.


Accessible admissions, a small campus and Memphis community roots complement the opportunity to compete in Division II.
Teams in Missouri
More Baseball Teams in Missouri
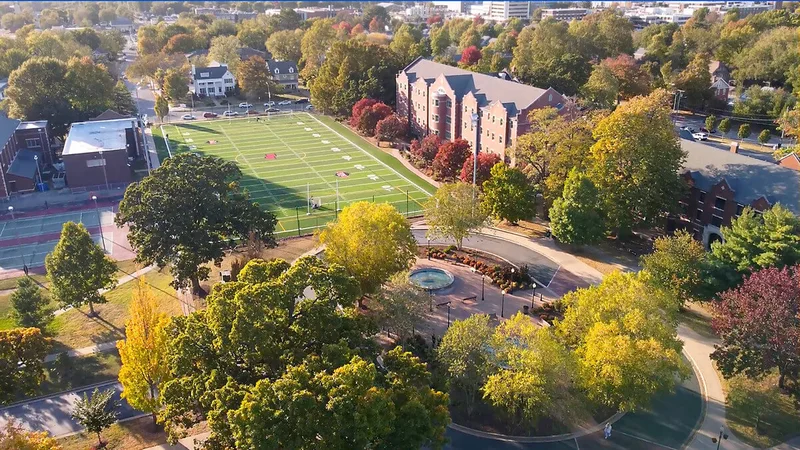

Drury University
Springfield, MO
Personalized academics and competitive conference play appeal to athletes who want a close-knit campus with professional pathways.


Maryville University of St. Louis
Town and Country, MO
Career-focused programs, reachable faculty and competitive athletics give recruits reasons to consider Maryville beyond their sport.


Technical academics, competitive athletics and strong career outcomes appeal to athletes looking beyond their playing years.


Rockhurst University
Kansas City, MO
Athletes choose the close-knit community, professional preparation and competitive athletics while staying connected to Kansas City opportunities.
Southwest Baptist University
Bolivar, MO
Faith-centered campus life and personal faculty attention give athletes a close-knit setting for study and competition.
Truman State University
Kirksville, MO
Close faculty connections, undergraduate research and affordable tuition appeal to athletes seeking a small-campus experience.
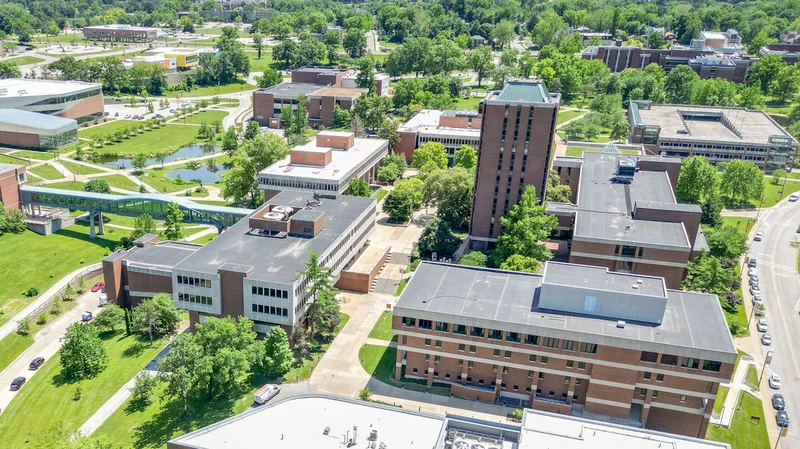

University of Missouri–St. Louis
St. Louis, MO
Career-focused programs, urban opportunities and financial aid give athletes practical reasons to consider competing here.
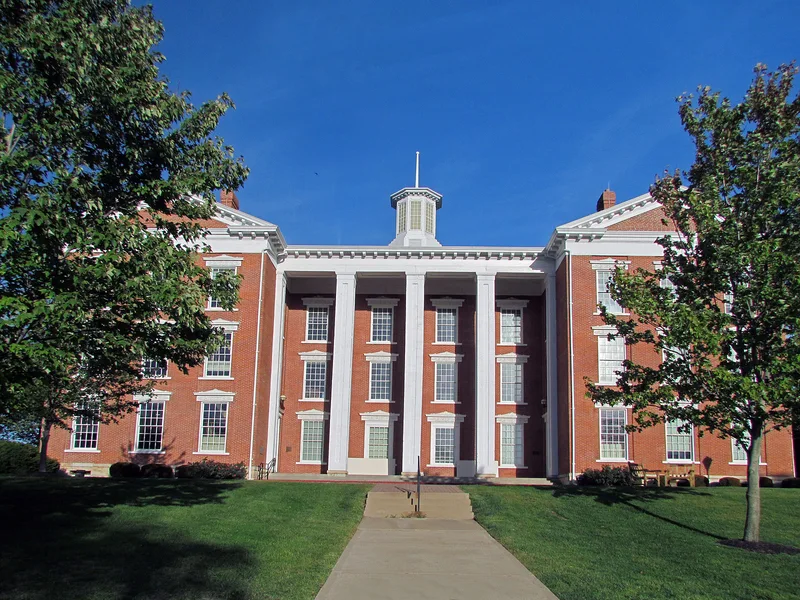

William Jewell College
Liberty, MO
Close faculty relationships, challenging academics and scholarship opportunities give athletes practical reasons to consider this small campus.
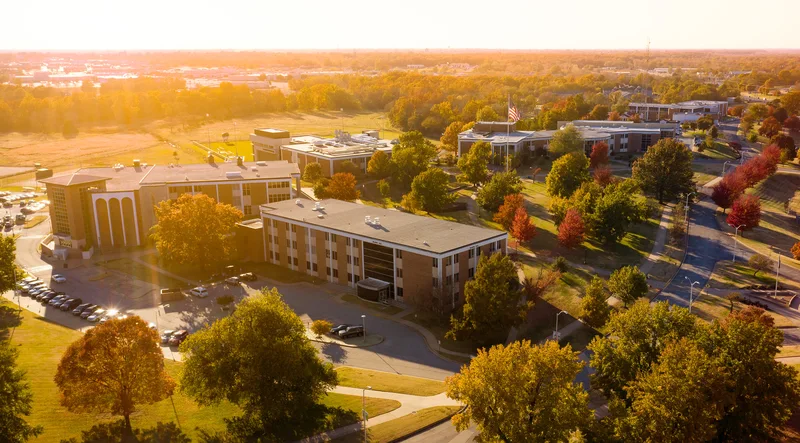

Missouri Southern State University
Joplin, MO
Regional competition, affordable costs and career-oriented academics appeal to athletes who also value a smaller campus community.
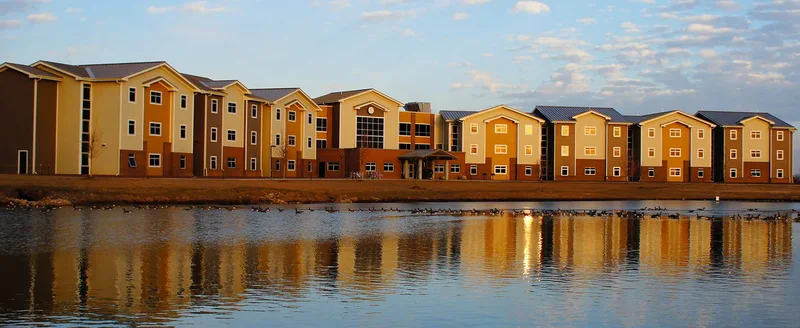

Missouri Western State University
St. Joseph, MO
Applied learning, accessible admissions and affordable options give recruits practical reasons to consider this small campus.


Northwest Missouri State University
Maryville, MO
Championship-level athletics, applied learning and a supportive small-town campus give recruits clear reasons to consider this university.


University of Central Missouri
Warrensburg, MO
Career-focused academics, competitive athletics and relatively affordable public tuition draw athletes to this residential campus.
Roster openings · 2026-27
Which D2 Baseball programs have the most roster spots opening up?
Every program ranked by players in their final year, with the positions they are losing.
11.6players leaving per program, on average
See the programs Three ways to start
Where are you in the search?
Pick the option that matches where you are, and we will show you the plan that fits.
Recruiting Plan
Your 20 to 25 best-fit schools, picked for you.



- Starter: the list, fit reads, real costs and a dated timeline
- Complete: adds roster reads and coach emails for every school
$99 or $249Starter or Complete, one time
Build my plan
Roster Report
The roster at your position, at the schools you pick.


- Who is graduating at your position, class year by class year
- Where spots are likely to open, in plain words
From $193, 8 or 15 schools
Choose my schools
School Plan
One school, covered end to end.
- Your honest odds, the roster and the verified coach
- Intro email, three follow-ups, admissions steps and timeline
$49One school, one time
Pick my school Resources