
Mid-South Conference competition, a small Christian campus and a relatively low net price draw athletes to Bethel.

NAIAMid-South ConferenceTennessee

Cumberland University Men's Soccer
One plan built for Cumberland University Men's Soccer, with the roster read, the coach's contact and a dated plan, delivered within 24 hours. An expert checks every plan.
- 25
- Roster
- 8
- Leaving
- 24%
- In-state
- 16%
- Transfers
Overview
Cumberland University Men's Soccer Team Details
Key facts about the Cumberland University men's soccer team.
Based in Lebanon, Tennessee, Cumberland University competes in the Mid-South Conference at the NAIA level in men's soccer. After the 2026-27 season, it loses three midfielders, the most of any position group, followed by two defenders. It has finished above .500 in each of the last five seasons.
NAIAMid-South ConferenceSoutheastTennessee
- Head coach
- Brian Davies
- Home venue
- Lindsey Donnell Stadium-Kirk Field
- Average roster
- 27
- Five-year win rate
- 69%
Head Coach
players a season
Fit check
Do You Fit at Cumberland University?
Pick your position and level, add a test score if you have one, and get an instant read on your chances here. Free, and no account needed.
Coaching staff
Get on This Staff's Radar
Head coach
Brian DaviesHead CoachEmail●●●●●●@●●●●.edu
Phone(●●●) ●●●-●●●●
Roster
Roster Breakdown
The roster by class
3FreshmenFr.
2SophomoresSo.
12JuniorsJr.
7SeniorsSr.
1GraduateGrad
25 players on the latest roster (2026).
Roster openings after 2026-27
8players in their final year, 32% of the roster
Goalkeeper 1 · Defender 2 · Midfielder 3 · Forward 2
Departures reach 32% of the roster after the 2026-27 season, eight players in total, a share in the top quarter among NAIA men's soccer teams, so the Class of 2027 should find real room. Midfielders are where that class has the most room: three leave after that season, followed by two defenders. Recruits at those positions would face the least entrenched competition.
See who you would be replacingNumbers are lean here, with 25 players where a typical team in NAIA men's soccer lists 32. With fewer players, each roster spot carries more weight.
Positions
Men's Soccer Roster by Position
How many players a season the program carries at each position, and how tall they are.
Goalkeeper
4players a season
Average height 6'0"
Defender
8players a season
Average height 6'0"
Midfielder
7.7players a season
Average height 5'10"
Forward
7players a season
Average height 5'10"
At 15% of the roster, goalkeepers outnumber what the average NAIA men's soccer team carries, which is 11%.
Transfers
Transfers In and Out
4
transfers in for 2026-27
3
transfers out
- Share of the roster
- 16%
- Per 100 freshmen
- 133
- By position
- Goalkeeper 1 · Defender 1 · Midfielder 1 · Forward 1
- Came from
- 2 from Division I, 1 from Division II, 1 from NAIA
Footprint
Where This Team Recruits
Where the players are from
80players
In-state23.8%
Other US states10%
International66.2%
Counted from players on recent rosters with a known hometown.
Top home states
Tennessee24%
California8%
Pennsylvania1%
Utah1%
Results
Cumberland University Men's Soccer Recent Results
Swipe to see every season
2021
71%13-5-1overall
8-2-1conference
2022
63%8-4-3overall
5-2-3conference
2023
68%12-5-3overall
3-1-2conference
2024
67%12-6overall
3-3conference
Best season
2025
74%14-4-3overall
3-2-1conference
Consistency shows in the results: five winning seasons in a row, a 69% winning percentage. The 2025 season was the strongest of the last five seasons, a 14-4-3 finish at 74%.
Standings
Mid-South Conference Standings
Where Cumberland University stands in the Mid-South Conference.
Schedule and travel
Men's Soccer Schedule
The season's games, home and away, and how far the team travels.
Recruiting
Recruiting Outlook
Who fits this program
- Competes in NAIA Mid-South Conference soccer competition
- Supports athletes balancing focused academics with athletics
- Set in a small suburban campus with a tight community
- Ideal for self-driven soccer players seeking development and growth
Program stats
The Program by the Numbers
27
Athletes on the roster
2
Coaches on staff
$3,087
Spent per athlete
Spending and revenue a year
Spending$788,815
Revenue$797,234
Revenue covers everything the program spends.
According to the 2025 EADA report, the program spends roughly $3,300 per athlete on operations, more than twice the NAIA median.
Source: the federal Equity in Athletics report, 2025.
Feeders
Top Feeder Schools and Clubs
The high schools and clubs that sent the most players to this roster.
1Hendersonville High School2 players on recent rosters
The school
School Environment
Cumberland University pairs liberal arts study with applied programs in nursing, education and business, making academic fit a balance of career direction, classroom expectations and time devoted to athletics.
Cumberland UniversityLebanon, TennesseeSee the full profile 67%
Acceptance rate
46%
Graduation rate
- Undergraduates
- 2,745
- Net price a year
- $18,759
- Earnings after ten years
- $57,687
Official links
Official Cumberland University Men's Soccer Links
Similar programs
Similar Soccer Teams
Programs at a similar level, with similar academics, worth adding to your recruiting list.
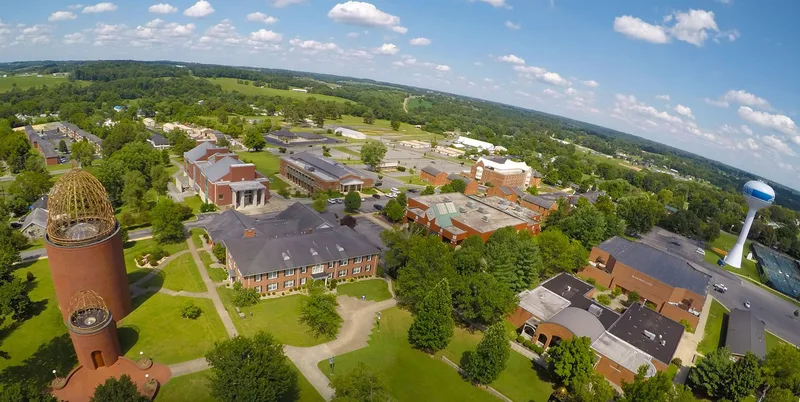

Championship experience, professional study options and a close-knit campus give athletes distinct reasons to consider Lindsey Wilson.


Personal faculty attention, NAIA competition and a close-knit campus give athletes a connected college experience.
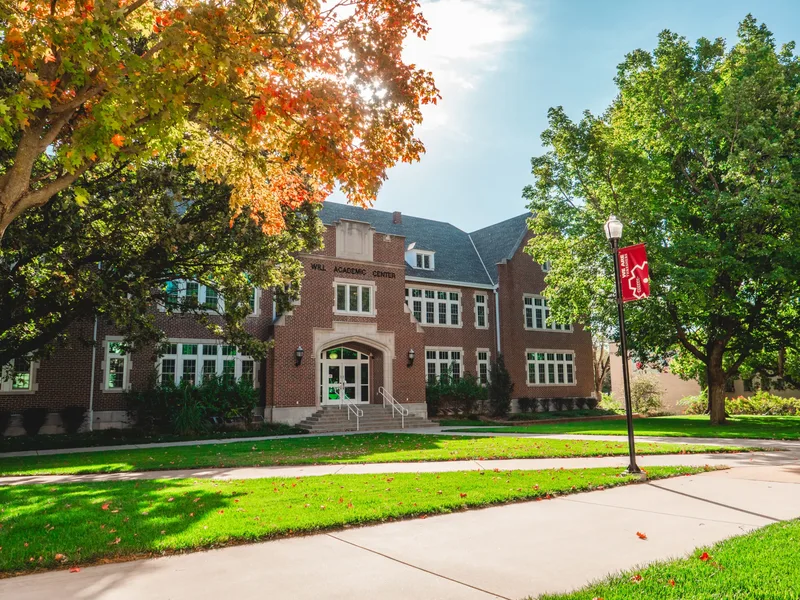

NAIA competition with athletic aid, a Christian community and accessible admissions give athletes practical reasons to consider Bethel.
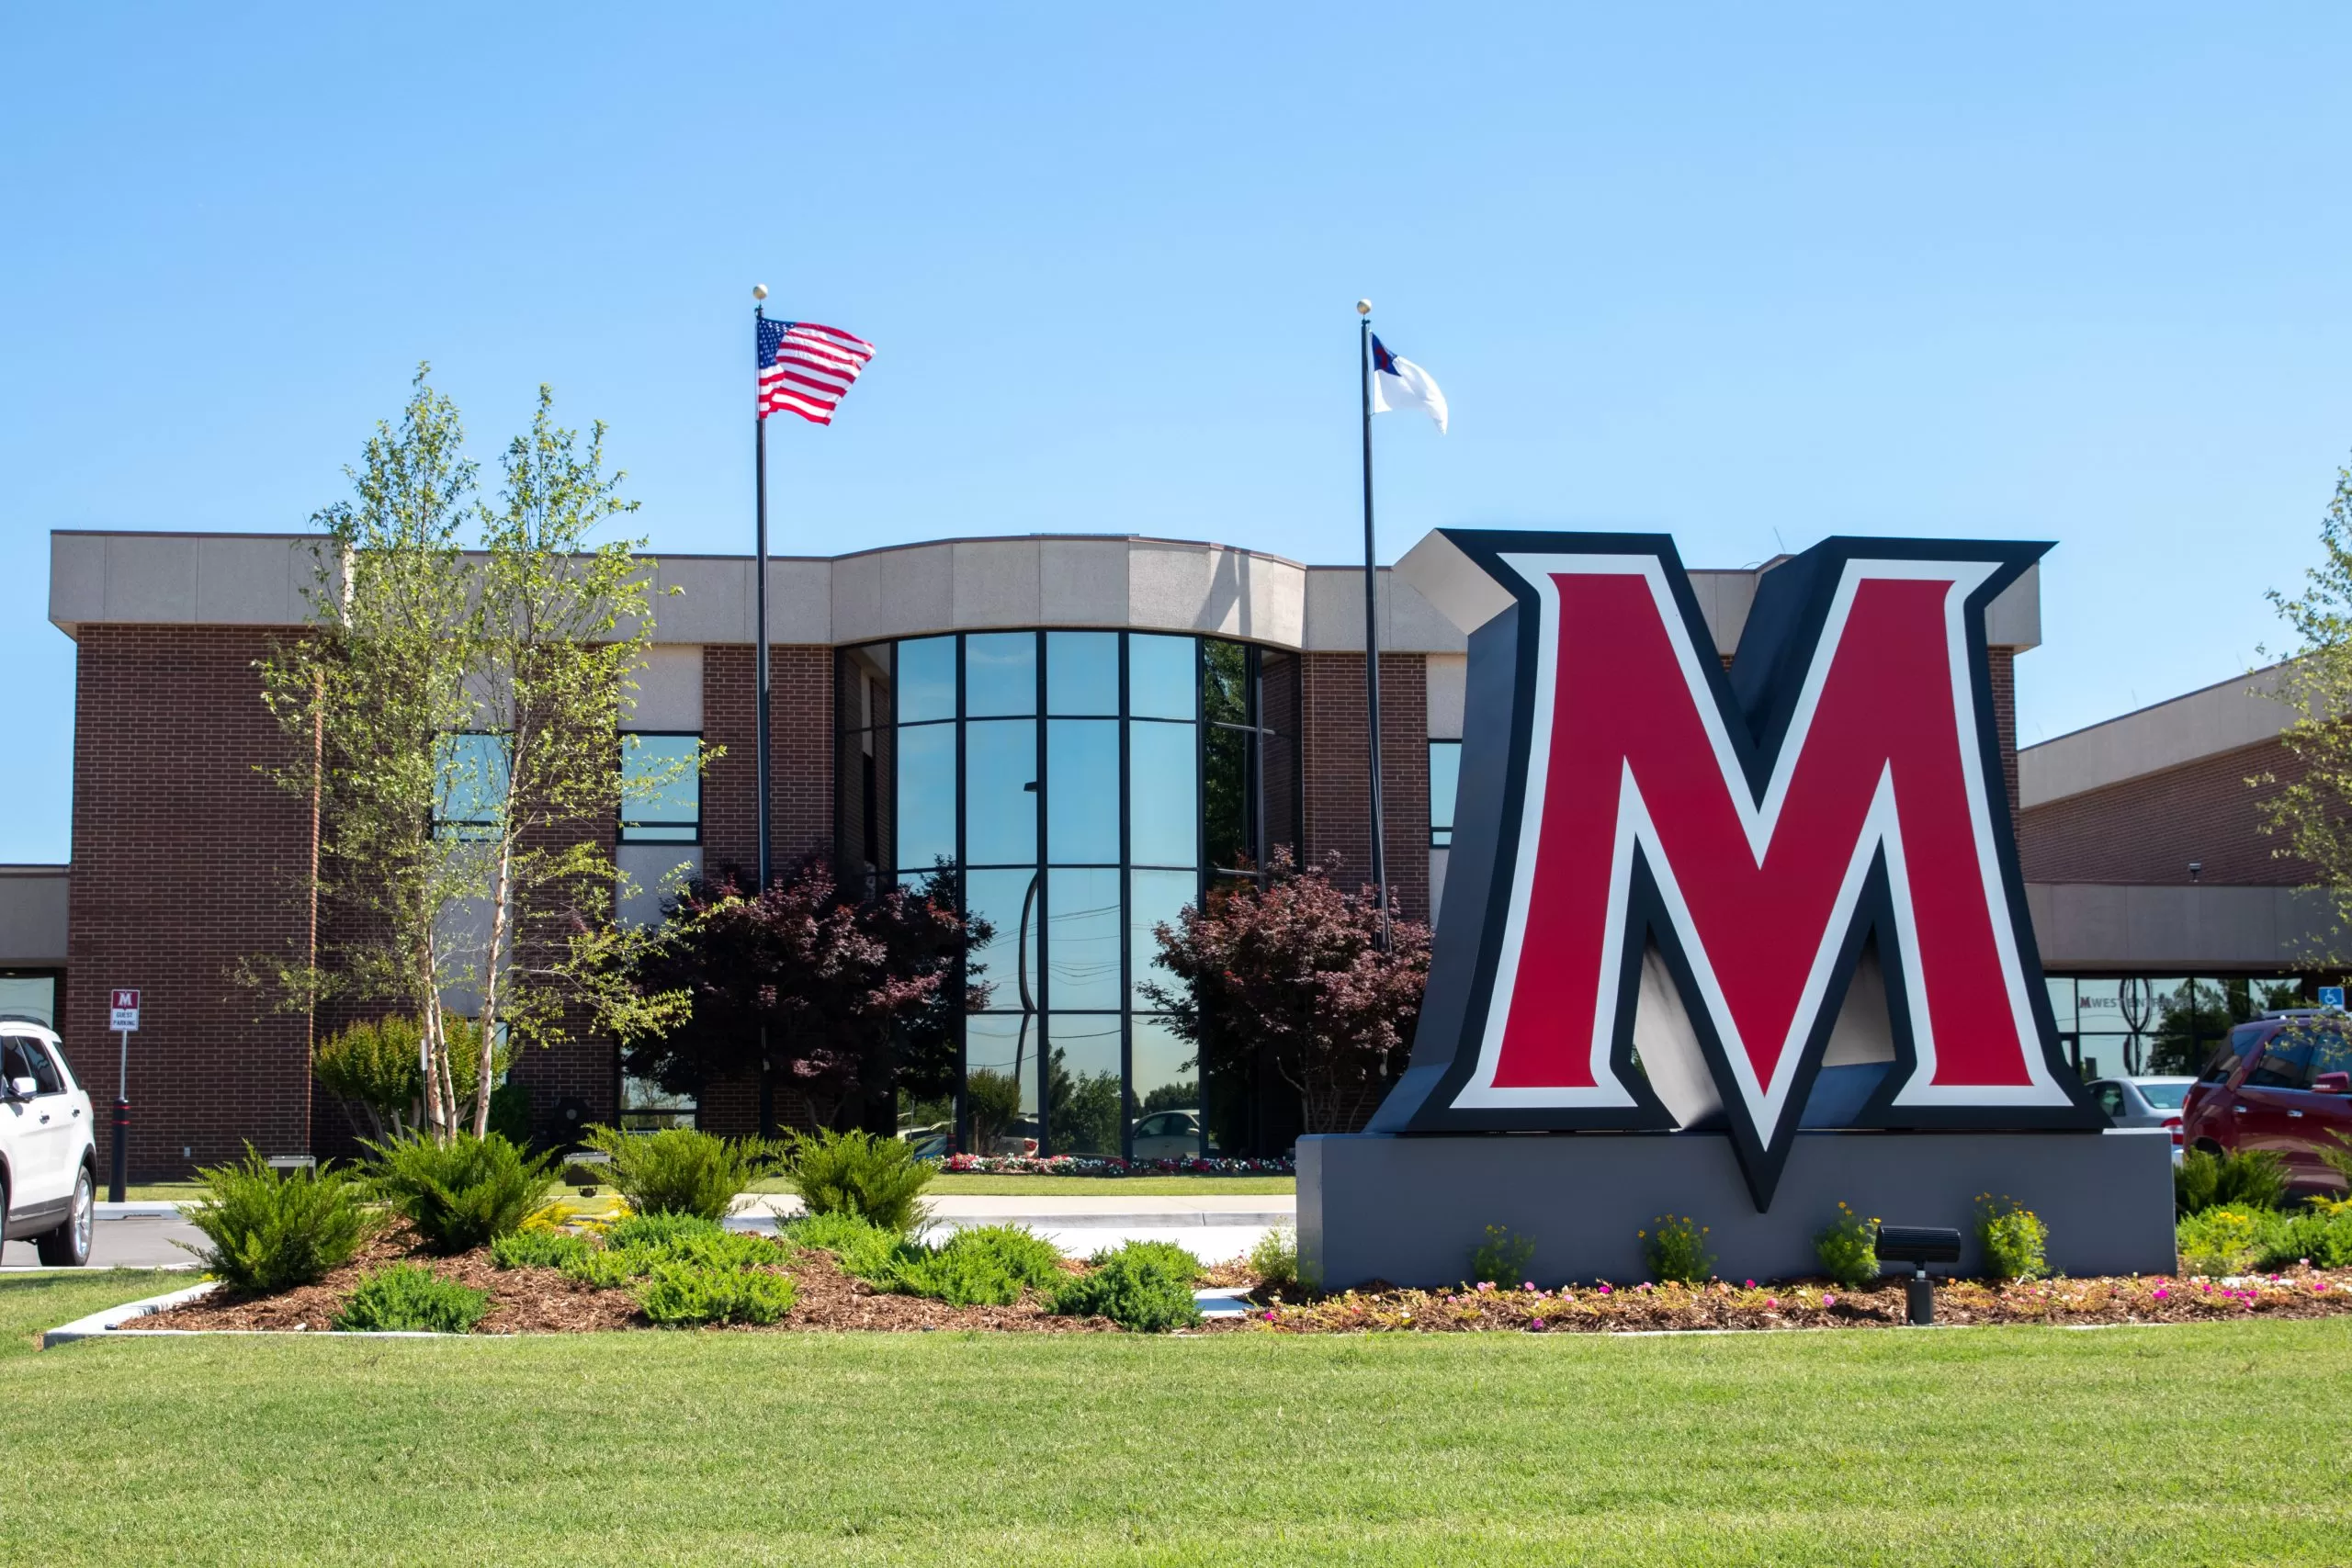

A small campus, career-focused degrees and Sooner Athletic Conference competition give athletes several reasons to consider this school.


Career-focused programs, flexible learning formats and Southern California opportunities give athletes practical reasons to consider this school.
Teams in Tennessee
More Soccer Teams in Tennessee


Bryan College
Dayton, TN
A Christian community, personal academic environment and NAIA competition give athletes a clear sense of fit.


Fisk University
Nashville, TN
Athletes choose Fisk for its close-knit HBCU community, reachable faculty, NAIA competition and Nashville opportunities.


Freed-Hardeman University
Henderson, TN
Athletes choose a close-knit Christian community where personal faculty support complements competitive Mid-South Conference athletics.


Johnson University
Knoxville, TN
A small campus, NAIA competition and service-focused academics offer athletes a connected college experience near Knoxville.
Milligan University
Milligan, TN
Personal faculty attention, NAIA competition and a close-knit campus give athletes a connected college experience.


University of Tennessee Southern
Pulaski, TN
A close-knit campus, approachable faculty and NAIA competition appeal to athletes who prefer a smaller college environment.


Tennessee Wesleyan University
Athens, TN
A small campus, approachable faculty and professional majors give athletes reasons to look beyond the playing field.
Roster openings · 2026-27
Which NAIA Men's Soccer programs have the most roster spots opening up?
Every program ranked by players in their final year, with the positions they are losing.
8.1players leaving per program, on average
See the programs Three ways to start
Where are you in the search?
Pick the option that matches where you are, and we will show you the plan that fits.
Recruiting Plan
Your 20 to 25 best-fit schools, picked for you.



- Starter: the list, fit reads, real costs and a dated timeline
- Complete: adds roster reads and coach emails for every school
$99 or $249Starter or Complete, one time
Build my plan
Roster Report
The roster at your position, at the schools you pick.


- Who is graduating at your position, class year by class year
- Where spots are likely to open, in plain words
From $193, 8 or 15 schools
Choose my schools
School Plan
One school, covered end to end.
- Your honest odds, the roster and the verified coach
- Intro email, three follow-ups, admissions steps and timeline
$49One school, one time
Pick my school Resources