The big picture
How Much These Rosters Turn Over Programs lose about as many players each year as they bring in, and the class of 2027 will fill the spots left by this year's final-year players.
Leaving 2.5
Arriving 3.2
Players in their final year against freshmen on the current roster, per program on average.
Players leaving across the division 260
Median per program 2
Programs tracked 102 Most openings
D2 Men's Tennis Programs Losing the Most Players Ranked by players in their final year on the current roster.
#1 Lakeland · FL · Sunshine State Conference
8 of 18 players in their final year44% of the roster
18 Average roster
63% 5-year win rate
32% In-state #2 Belmont · NC · Conference Carolinas
8 of 32 players in their final year25% of the roster
39 Average roster
55% 5-year win rate
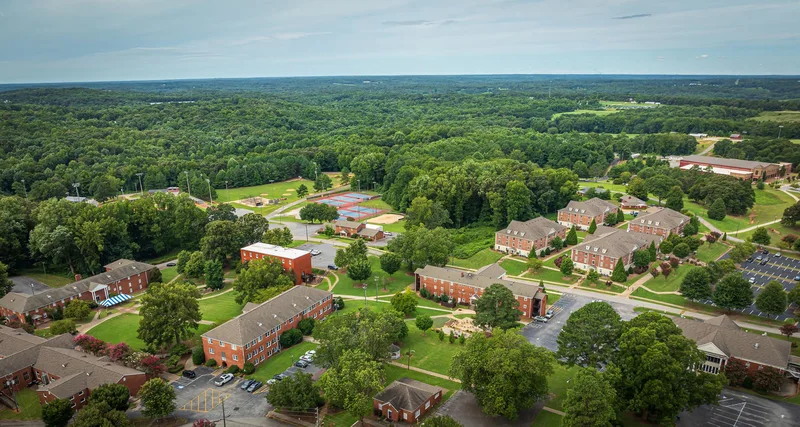
16% In-state #3 Tigerville · SC · Conference Carolinas
6 of 9 players in their final year67% of the roster
11 Average roster
32% 5-year win rate
25% In-state #4 Daytona Beach · FL · Sunshine State Conference
6 of 12 players in their final year50% of the roster
12 Average roster
65% 5-year win rate
19% In-state #5 Franklin Springs · GA · Conference Carolinas
6 of 13 players in their final year46% of the roster
11 Average roster
55% 5-year win rate
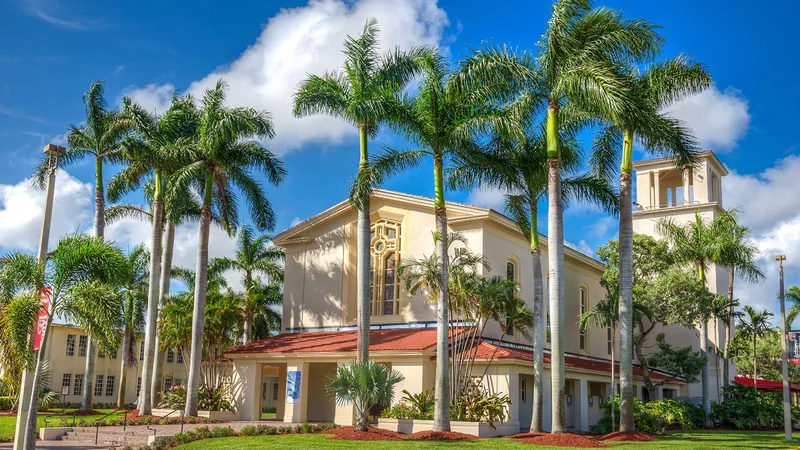
18% In-state #6 Miami Shores · FL · Sunshine State Conference
6 of 15 players in their final year40% of the roster
16 Average roster
83% 5-year win rate
22% In-state #7 Anderson · SC · South Atlantic Conference
6 of 18 players in their final year33% of the roster
17 Average roster
63% 5-year win rate
50% In-state #8 Queens · NY · Independent
5 of 11 players in their final year46% of the roster
12 Average roster
75% 5-year win rate
18% In-state #9 St. Leo · FL · Sunshine State Conference
5 of 12 players in their final year42% of the roster
14 Average roster
80% 5-year win rate
7% In-state #10 Kansas City · MO · Great Lakes Valley Conference
5 of 13 players in their final year39% of the roster
12 Average roster
57% 5-year win rate
18% In-state #11 Maryville · MO · Mid-America Intercollegiate Athletics Association
5 of 13 players in their final year39% of the roster
12 Average roster
63% 5-year win rate
9% In-state #12 Springfield · MO · Great Lakes Valley Conference
5 of 15 players in their final year33% of the roster
15 Average roster
68% 5-year win rate
10% In-state #13 Dahlonega · GA · Peach Belt Conference
4 of 9 players in their final year44% of the roster
10 Average roster
14% In-state #14 Macon · GA · Peach Belt Conference
4 of 10 players in their final year40% of the roster
10 Average roster
58% 5-year win rate
0% In-state #15 Wise · VA · South Atlantic Conference
4 of 11 players in their final year36% of the roster
11 Average roster
43% 5-year win rate
0% In-state #16 Institute · WV · Mountain East Conference
4 of 11 players in their final year36% of the roster
9 Average roster
40% 5-year win rate
4% In-state #17 Portsmouth · OH · Mountain East Conference
4 of 11 players in their final year36% of the roster
10 Average roster
20% 5-year win rate
40% In-state #18 Boca Raton · FL · Sunshine State Conference
4 of 12 players in their final year33% of the roster
15 Average roster
60% 5-year win rate
19% In-state #19 Allendale · MI · Great Lakes Intercollegiate Athletic Conference
4 of 12 players in their final year33% of the roster
11 Average roster
69% 5-year win rate
0% In-state #20 Charleston · WV · Mountain East Conference
4 of 13 players in their final year31% of the roster
13 Average roster
59% 5-year win rate
0% In-state #21 4 of 14 players in their final year29% of the roster
13 Average roster
31% 5-year win rate
21% In-state #22 Atherton · CA · Pacific West Conference
4 of 20 players in their final year20% of the roster
17 Average roster
60% 5-year win rate
4% In-state #23 Ashland · OH · Great Midwest Athletic Conference
3 of 7 players in their final year43% of the roster
8 Average roster
44% 5-year win rate
8% In-state #24 San Diego · CA · Pacific West Conference
3 of 7 players in their final year43% of the roster
8 Average roster
59% 5-year win rate
16% In-state Show 12 more programs How to read it
What These Roster Openings Mean Here is how to read these numbers and use them to decide which programs to contact first.
01 More room More players leaving usually means more room in the next recruiting class, especially at your position.
02 Not guaranteed Coaches also fill spots with transfers, and some players use an extra year, so treat these as openings to explore, not guaranteed spots.
03 Prioritize Use it to decide which programs to contact first, starting with the ones losing players at your position.
Based on 2026-27 college rosters. Counts seniors and graduate students. Updated every season.
Keep exploring
More Resources Three ways to start
Where are you in the search? Pick the option that matches where you are, and we will show you the plan that fits.
I need a list Not sure where to look yet
I have a few schools Do they have room for me?
I know the school How do I get in?
Recruiting Plan
Your 20 to 25 best-fit schools, picked for you.
Roster Report
The roster at your position, at the schools you pick.
Notre Dame · Women's Soccer Your position, by class year 2 opening
School Plan
One school, covered end to end.
University of Maryland Women's soccer · Big Ten 73 Realistic target2 spots opening Coach verified Admissions Nov 1 Real cost $21k
Sport hub
Everything for Men's Tennis recruiting The Men's Tennis hub brings every division together: how D1, D2, D3 and NAIA compare, the strongest programs in each state, camps, and the recruiting guides for each level.
237 D1 programs149 D2 programs297 D3 programs110 NAIA programs
Go to the Men's Tennis hub